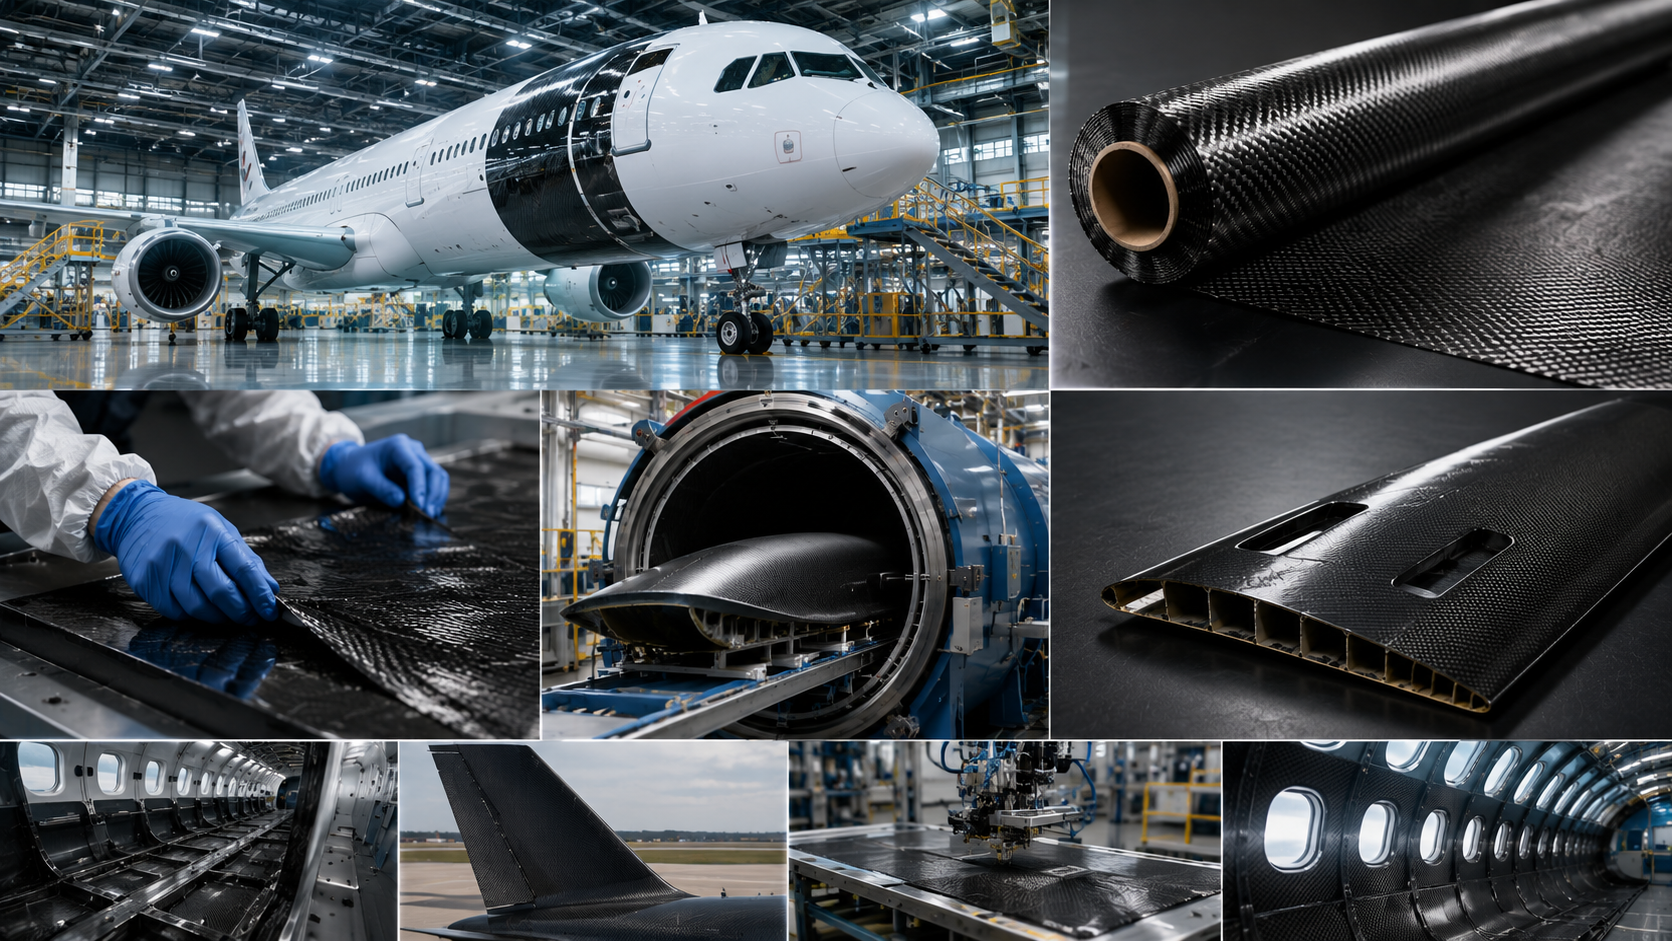
Carbon fiber is everywhere these days—from Formula 1 race cars to the wings of modern aircraft. It’s often called the “black gold” of materials, and for good reason. But making it? That is a serious engineering challenge.
It’s not just about heating up plastic strands. It’s a precise chemical process where atoms are forced to realign into a near-perfect structure. Even a tiny change in temperature or tension can ruin the entire batch. In this guide, we’ll cut through the noise and walk you through exactly how raw liquid polymer transforms into the strongest fiber on earth—step by technical step.
Carbon Fiber Precursor Material Selection and Preparation
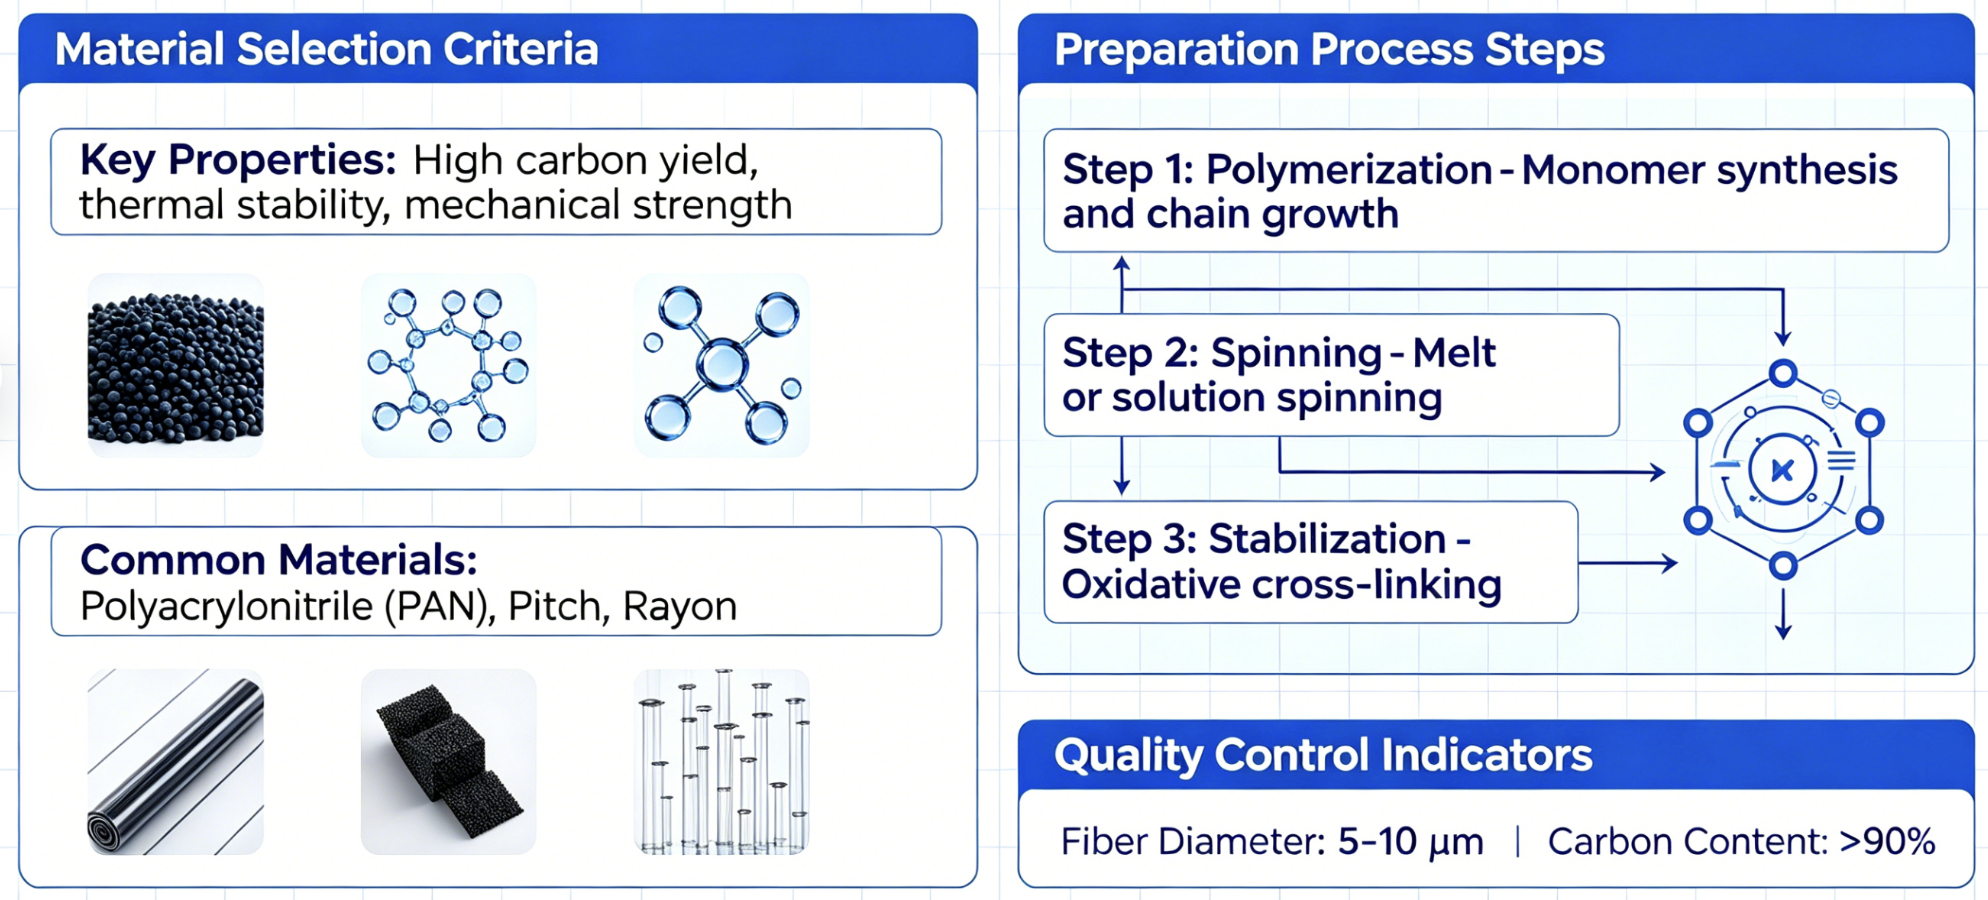
Pick the wrong starting material and you’ve lost the game. Polyacrylonitrile precursor takes 90% of the market. Why? It delivers carbon fibers with 6.6 GPa tensile strength on average. Pitch holds 10% market share. Rayon sits under 1%.
PAN wins because of its carbon yield and molecular structure. Each fiber strand can hold 50,000 individual filaments. The industry calls these 50K filaments. That density drives production efficiency.
PAN demands precision though. You need over 99% final carbon content. The melting point must hit specific targets. Molecular weight can’t drift. Too low? The fiber weakens. Too high? Your spinning costs spike. You need exact control over the crystalline structure. Even filament diameter stays within a tight 5-10 micrometer range.
|
Precursor |
Strength (MPa) |
Modulus |
Carbon Yield |
Cost Range |
|---|---|---|---|---|
|
PAN |
High |
Moderate |
High |
$11.1/kg precursor, $25.15-36.25/kg final fiber |
|
Pitch |
Moderate |
High |
Highest |
Higher cost, superior conductivity |
|
Rayon |
Proven high stiffness/weight |
High |
Low |
Expensive, ablative applications |
|
Lignin |
Poor |
Low |
Low |
Budget alternative, limited use |
PAN Production Workflow
The process starts in reactors. Acrylonitrile monomers combine with comonomers. This forms PAN polymer. After separation and washing, manufacturers push the material into pellets. These pellets dissolve and spin into thin filaments. You can use wet, dry, or air-gap spinning methods.
Post-spinning makes or breaks quality. Stretch the fibers above glass transition temperature. This aligns molecules. Temperature, pressure, and mixing ratios control the crystalline structure. That structure sets final strength.
Current PAN-based fibers hit 6.6 GPa average. That’s just 10% of theoretical maximum strength. Boost molecular weight and pre-stretch the fibers. This helps close that gap. Some manufacturers test melt-spun or dry-spun PAN. This cuts solvent expenses. High-rate stabilization can triple throughput.
Pitch-based alternatives handle more impurities. But they trade tensile strength for thermal properties. Options like lignin cost less but don’t perform well. Cellulose and algae-based precursors stay in the lab. They’re not ready for industrial scale yet.
Step 1: Fiber Spinning Process – Creating the Base Filaments
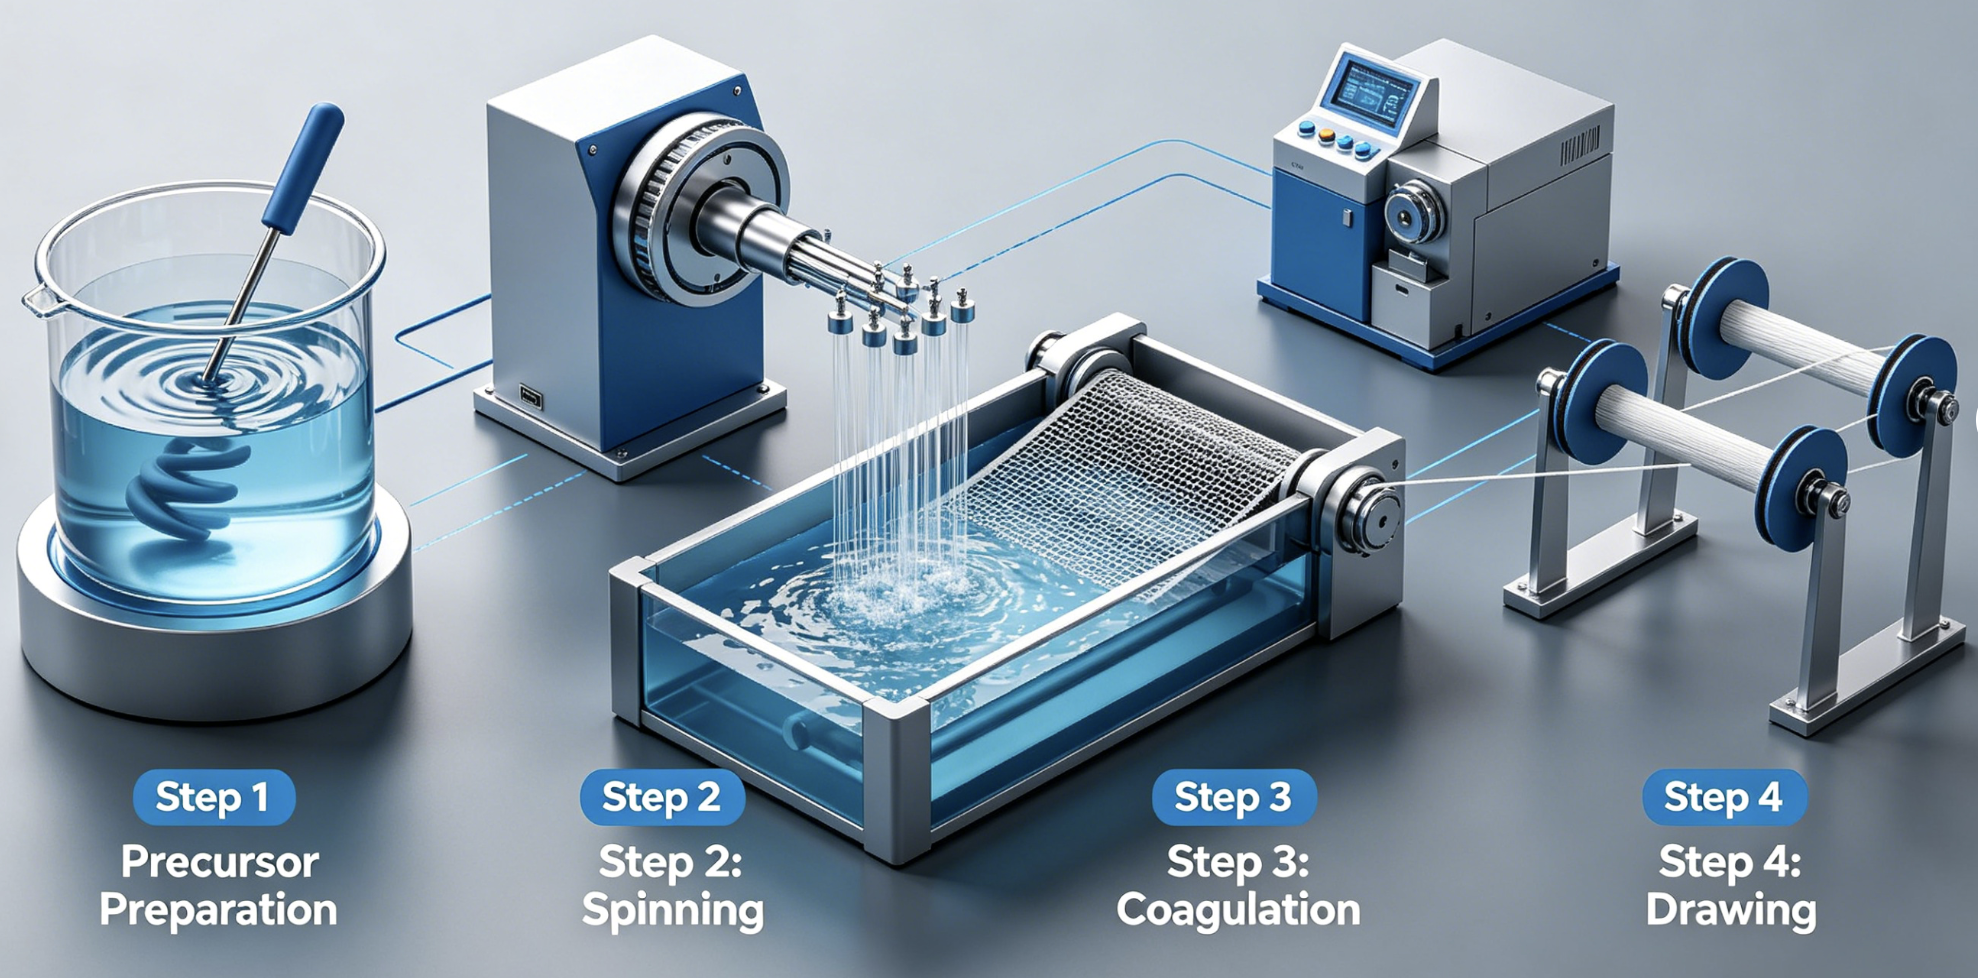
You need precision at every point to turn polymer solution into uniform filaments. The spinning stage sets the foundation for everything that comes next. Get the parameters wrong here? No amount of downstream processing will save your material.
Shear Force Spinning: The Mechanical Approach
Shear force spinning pumps polymer solution through a needle at 0.5 mL/hr. A rotating collector contacts each drop. It pulls the drops into filaments. This method gives you consistent fiber spacing. Electrospinning can’t match this consistency.
The numbers show the difference. Shear force spinning produces 230 μm average spacing with just 18% relative standard deviation. Compare that to electrospinning’s 11 μm spacing with 39% RSD. Consistency matters more than the spacing itself. At 1.1 mm/s translational speed, maximum spacing hits 510 μm with 24% RSD.
Rotation speed controls fiber diameter. Increase from 450 to 620 rpm and diameter drops 5-fold. Higher speeds deform polymer chains more. This stretches them thinner.
Solution Chemistry Controls Everything
Here’s the optimal formula for polystyrene: 30 wt.% in a 7:3 volume ratio of toluene to acetone. Push this through a 22G needle. You get the widest processing range. The draw-down ratio reaches ~10³ for continuous fiber production.
|
Polymer Solution |
Viscosity (Pa·s) |
Surface Tension (mN/m) |
Capillary Number |
Fiber Formation |
|---|---|---|---|---|
|
Polystyrene/Toluene/Acetone |
4.5 ± 0.3 |
13 ± 2 |
60 |
Yes |
Entanglement concentration sits at ~8 wt.% for polystyrene. Uniform fibers need 28 wt.% concentration. That’s about 3× the entanglement threshold. Keep the capillary number above 50. This prevents droplet breakup during formation.
Fiber spacing follows a simple equation: l = 1/(ωT). Here, l equals spacing in millimeters. ω is rotational speed in revolutions per second. T is translational speed in millimeters per second. At 170 RPM, this relationship shows a linear slope of 0.39 seconds.
Step 2: Stabilization (Oxidation) – Stopping Fiber Melt
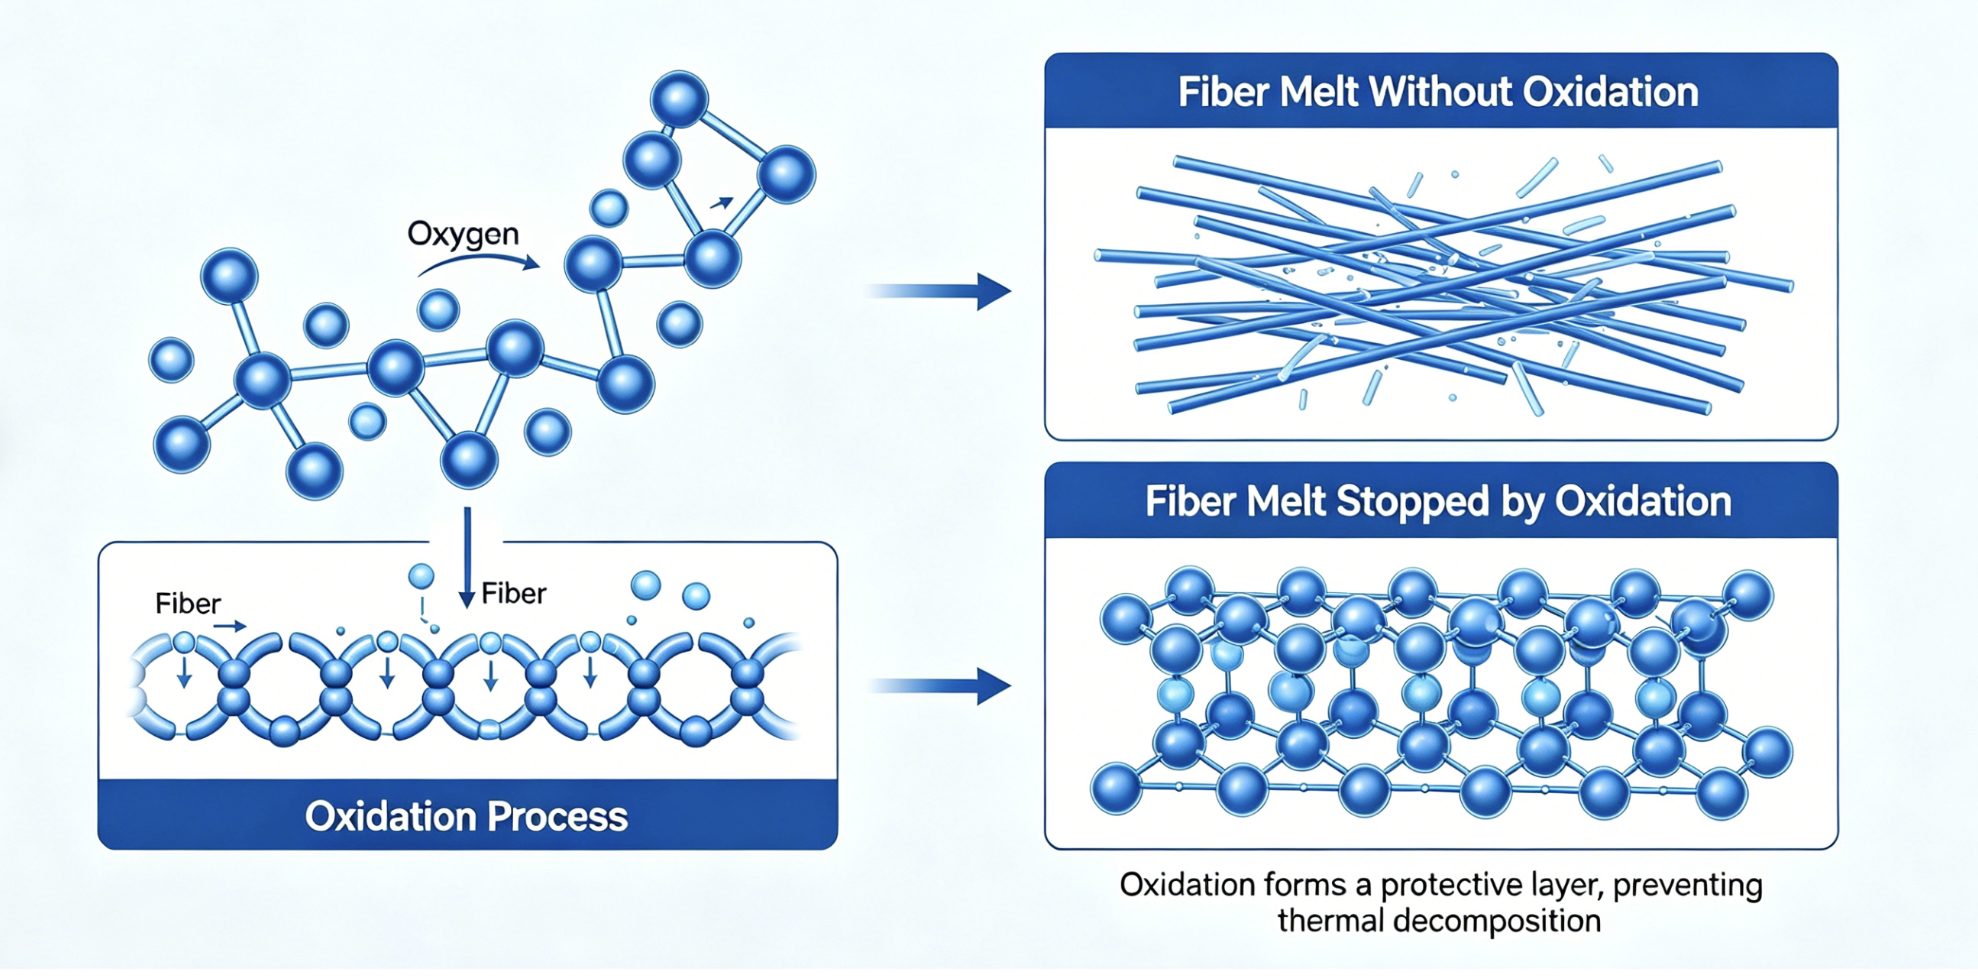
Heat untreated PAN fibers past 300°C and they melt into goo. Stabilization prevents this. This step changes thermoplastic PAN into a heat-resistant ladder polymer. You can’t skip this.
The process runs fibers through air at 200–280°C for 60–80 minutes. Three chemical reactions happen at once:
– Cyclization converts straight chains into ring structures
– Dehydrogenation releases hydrogen atoms
– Oxidation adds oxygen to the polymer backbone
Each reaction needs exact temperature control.
Temperature Zones Drive Different Chemistry
Below 180°C, nothing useful happens. Between 180–240°C, cyclization takes over. The nitrile groups (-C≡N) link together. This forms ladder structures. Push to 240–270°C and oxygen starts creating new cyclization centers. At 250–400°C, aromatization kicks in. Heavy crosslinking happens here.
Thermal analysis proves the change:
|
Temperature (°C) |
Heat Release (J/g) |
Stabilization Index |
|---|---|---|
|
Untreated |
276.6 |
0% |
|
160 |
230.3 |
16.7% |
|
170 |
118.6 |
57.1% |
That heat release drop shows conversion progress. By 170°C, you’ve finished over half the stabilization.
Oxygen Uptake Controls Final Quality
Pitch-based fibers need at least 2% oxygen uptake by weight. This prevents fusion during carbonization. The sweet spot sits at 1.5–3.5% oxygen. This creates stable fibers. They survive 1000°C carbonization without melting together.
Temperature affects oxygen absorption rates. At 260°C, uptake moves slow but produces highest tensile strength at 5% oxygen. Results vary a lot though. Jump to 280°C and properties stabilize. Just 60 minutes at this temperature matches longer processing times.
Push further to 290°C and you’ve gone too far. Too much oxidation forms unstable O=O bonds. Modulus drops. Weight loss starts despite oxygen addition.
FTIR spectroscopy shows what happens inside the fiber. Nitrile bonds disappear. Methylene groups vanish. Weak signals appear at 1730 cm⁻¹ showing carboxyl groups. At 1630 cm⁻¹ you see conjugated double bonds. Between 250–270°C, oxidation stays limited. Oxygen can’t diffuse fast enough into dense fiber cores.
Timing and Heating Rate Matter
Standard PAN oxidation takes 60–80 minutes. Advanced processes target under 40 minutes. Pitch fibers work best with slow heating. We use 10°C/min ramps. This gradual approach gives thorough oxidative crosslinking. Rush it and you get uneven conversion.
Shrinkage shows reaction progress. Entropic shrinkage hits maximum level with fibers hang free under zero tension. Chemical shrinkage starts at a specific onset time. This follows exponential curves. Before this onset, oxidation and dehydrogenation have little effect on fiber length.
Raman spectroscopy tracks oxidation in real-time. Above 200°C, D and G band activity signals reaction progress. Strong fluorescence confirms chemical changes. At 230°C, straight conjugated structures take over from dehydrogenation. Higher temperatures shift the balance. Dehydrogenation becomes less important. Other reactions take over.
Get stabilization right and your fibers survive carbonization. Mess it up and the entire batch fails.
Step 3: Low-Temperature Carbonization – Initial Carbon Formation
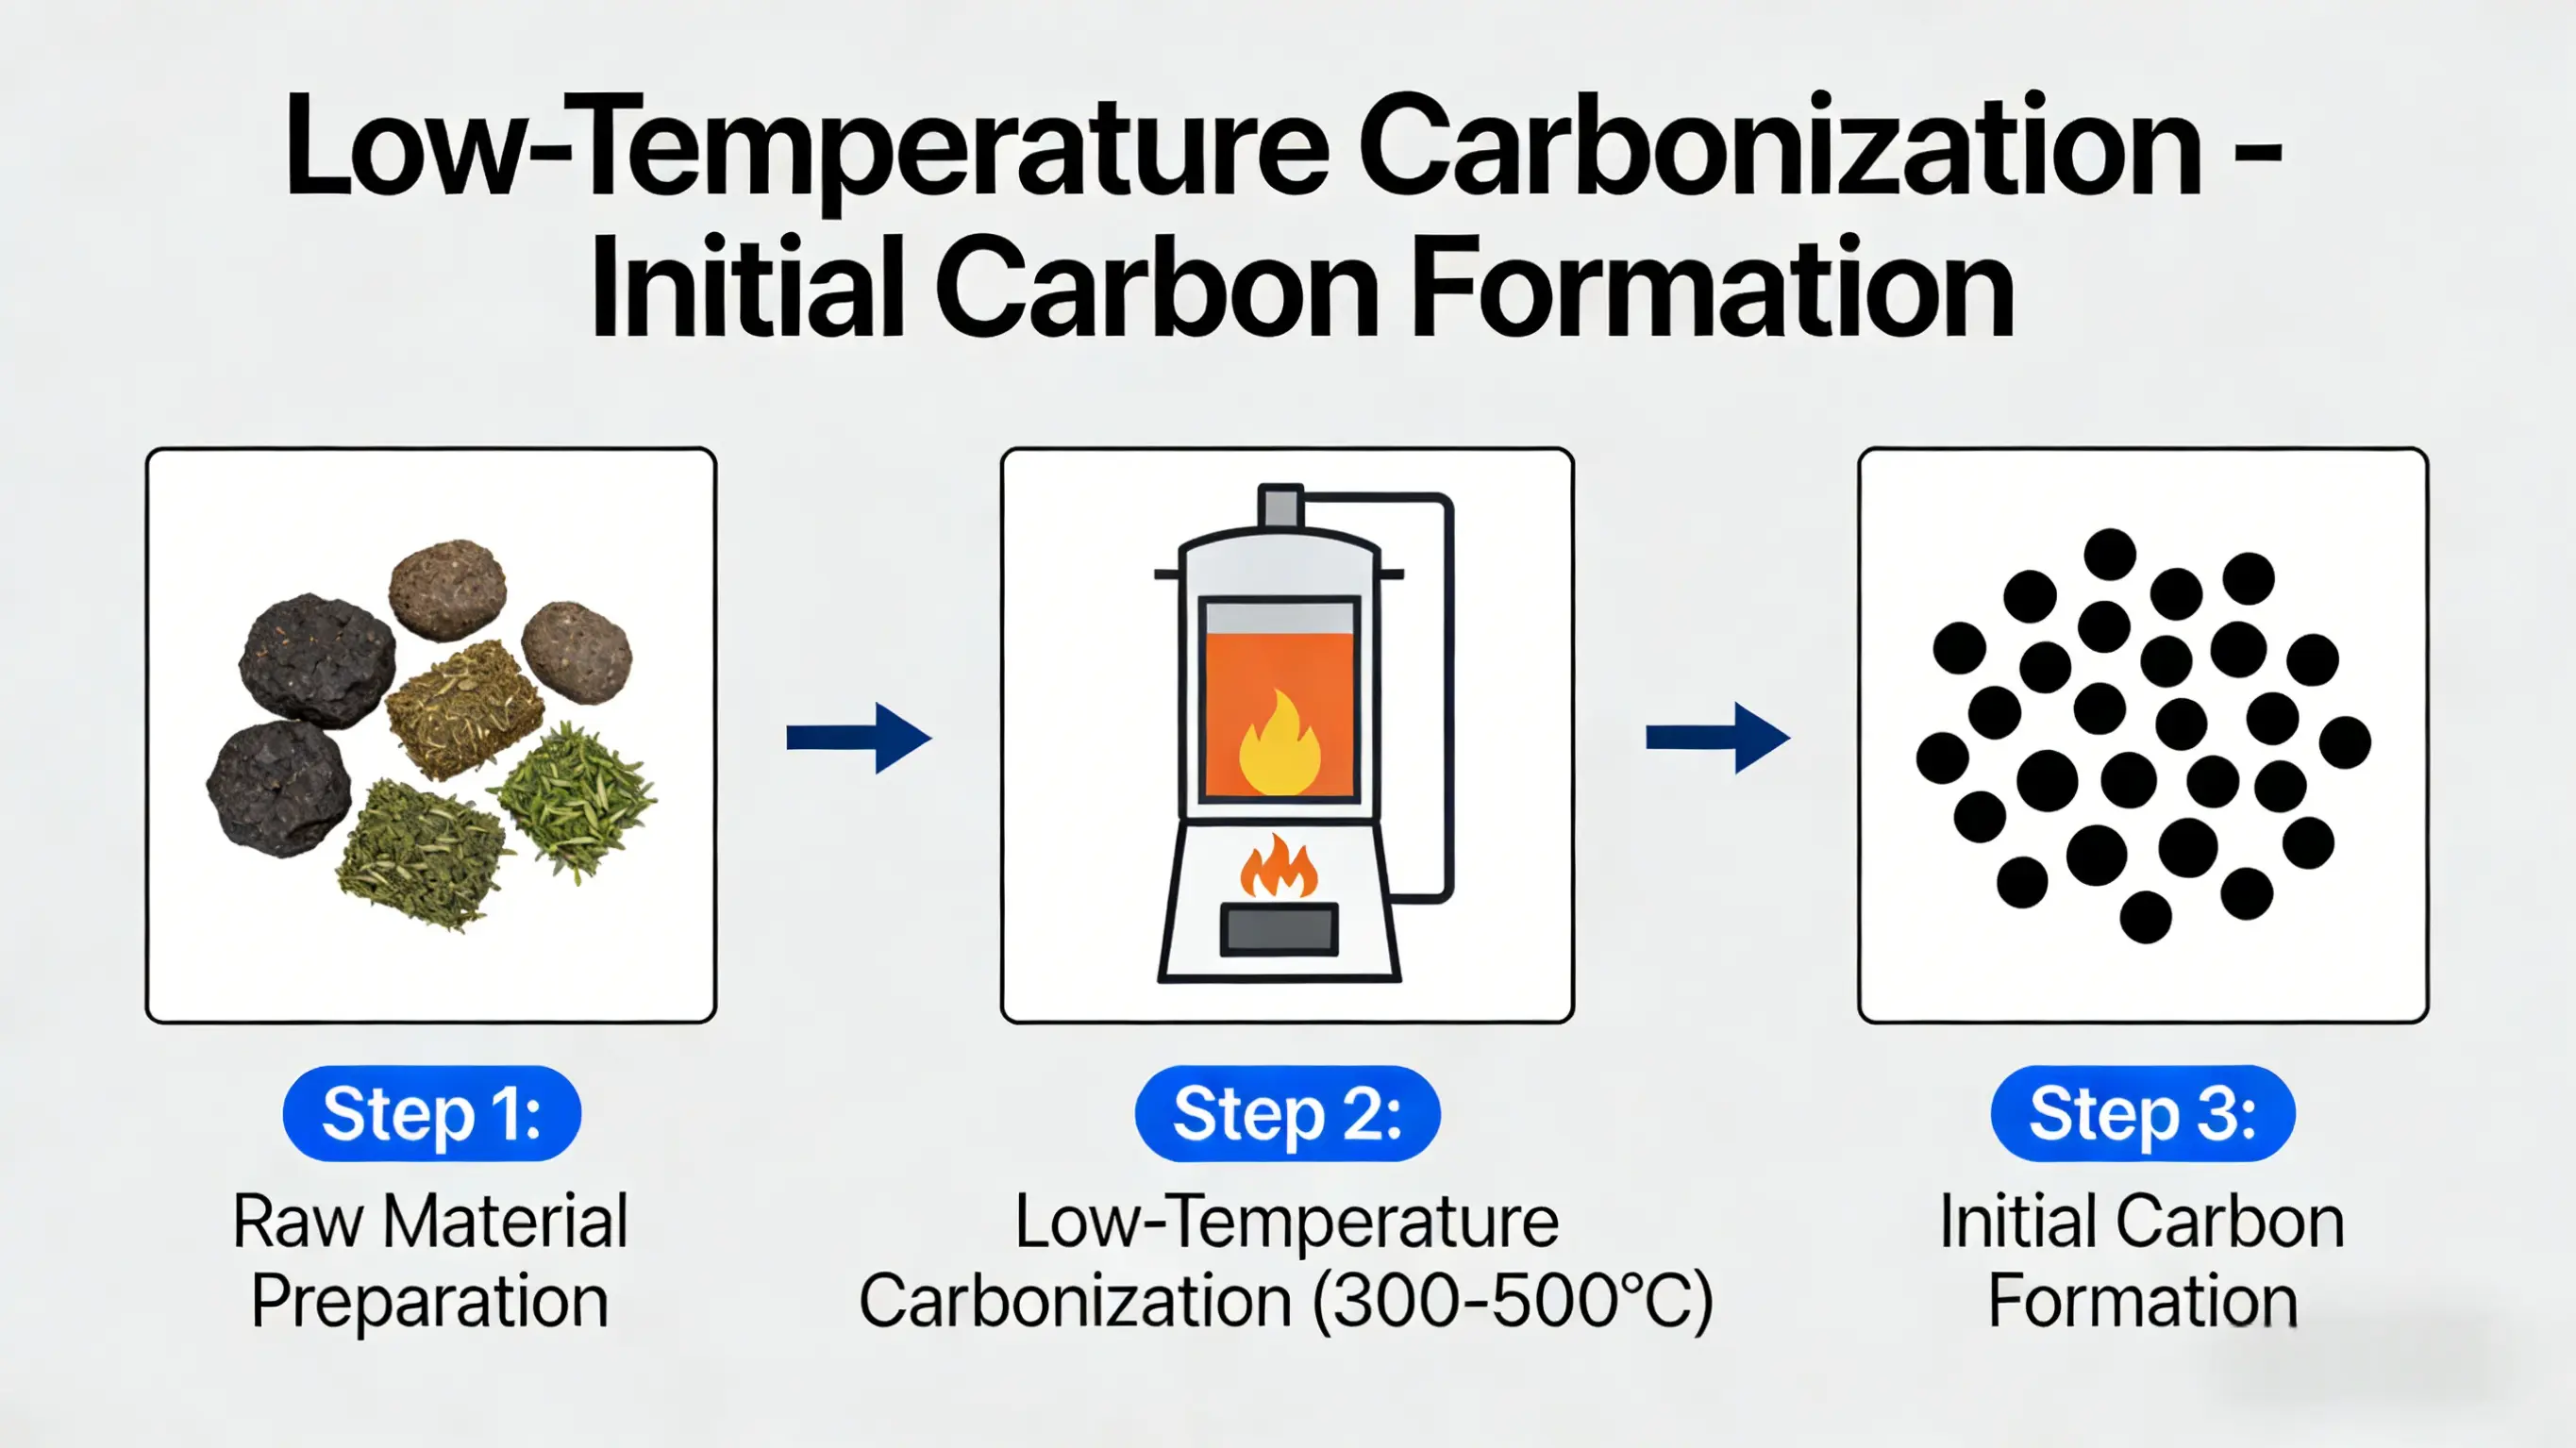
Carbonization happens in two phases. The first runs between 500–700°C. Chemistry gets messy here.
At 475–600°C, tar pours out of the fibers. Hydrocarbons escape. The polymer structure breaks into smaller pieces. Think of it as controlled demolition at the molecular level.
Keep the temperature below 750°C. Heavy hydrocarbons evacuate. High-energy gases rush out. Oils discharge. The reactions move slow here. Changes stay moderate. Xylene converts to toluene without drama.
Cross 750°C and everything speeds up. Lean gases form – hydrogen and marsh gas mainly. Secondary breakdown kicks in hard. Tars appear. Naphthalene shows up. Free carbon starts forming.
Here’s the tricky part: gases and vapors get trapped in the plastic mass. The material swells and expands. The fiber shifts from a plastic blob into thin crystal sheets. Scientists call this the mesophase mechanism.
Temperature climbs. Plasticity drops. The fused layer hardens back into semi-coke. You’ll spot it by the cellular structure – connected pores running through the material.
Low-temperature carbonization makes more liquid than the high-temperature version. Gas yield hits about 25% of what high-temperature processing makes. But the gas you get contains more methane and less hydrogen. This means higher heating value per volume.
The tar makeup differs too. Low-temperature tar runs heavy on aliphatic compounds. High-temperature tar leans aromatic.
At 600°C, volatile matter still sits in the semi-coke. The cellular, porous formation just started. Particle borders blur together and disappear. A froth zone develops – very porous with thin walls.
Pore size grows with temperature. Then something weird happens: you hit a low point at maximum pore size. Large pores shrink before they harden again. This leaves a stronger structure than you’d expect.
Primary breakdown products flooding out include:
– Tar
– Hydrocarbons
– Methane (CH₄)
– Water vapor
– Carbon monoxide and carbon dioxide
The process needs air-free conditions. Seal everything in an enclosed retort or kiln. Keep neutral pressure to control breakdown speed. Rush this and you wreck the fiber structure.
By 600°C, you’ve got semi-coke. It’s solid, smokeless, still packed with volatile matter. The cellular structure with connected pores is ready for the next heating phase to finish the job.
Step 4: High-Temperature Carbonization (Graphitization) – Hitting Your Target Properties – Hitting Your Target Properties
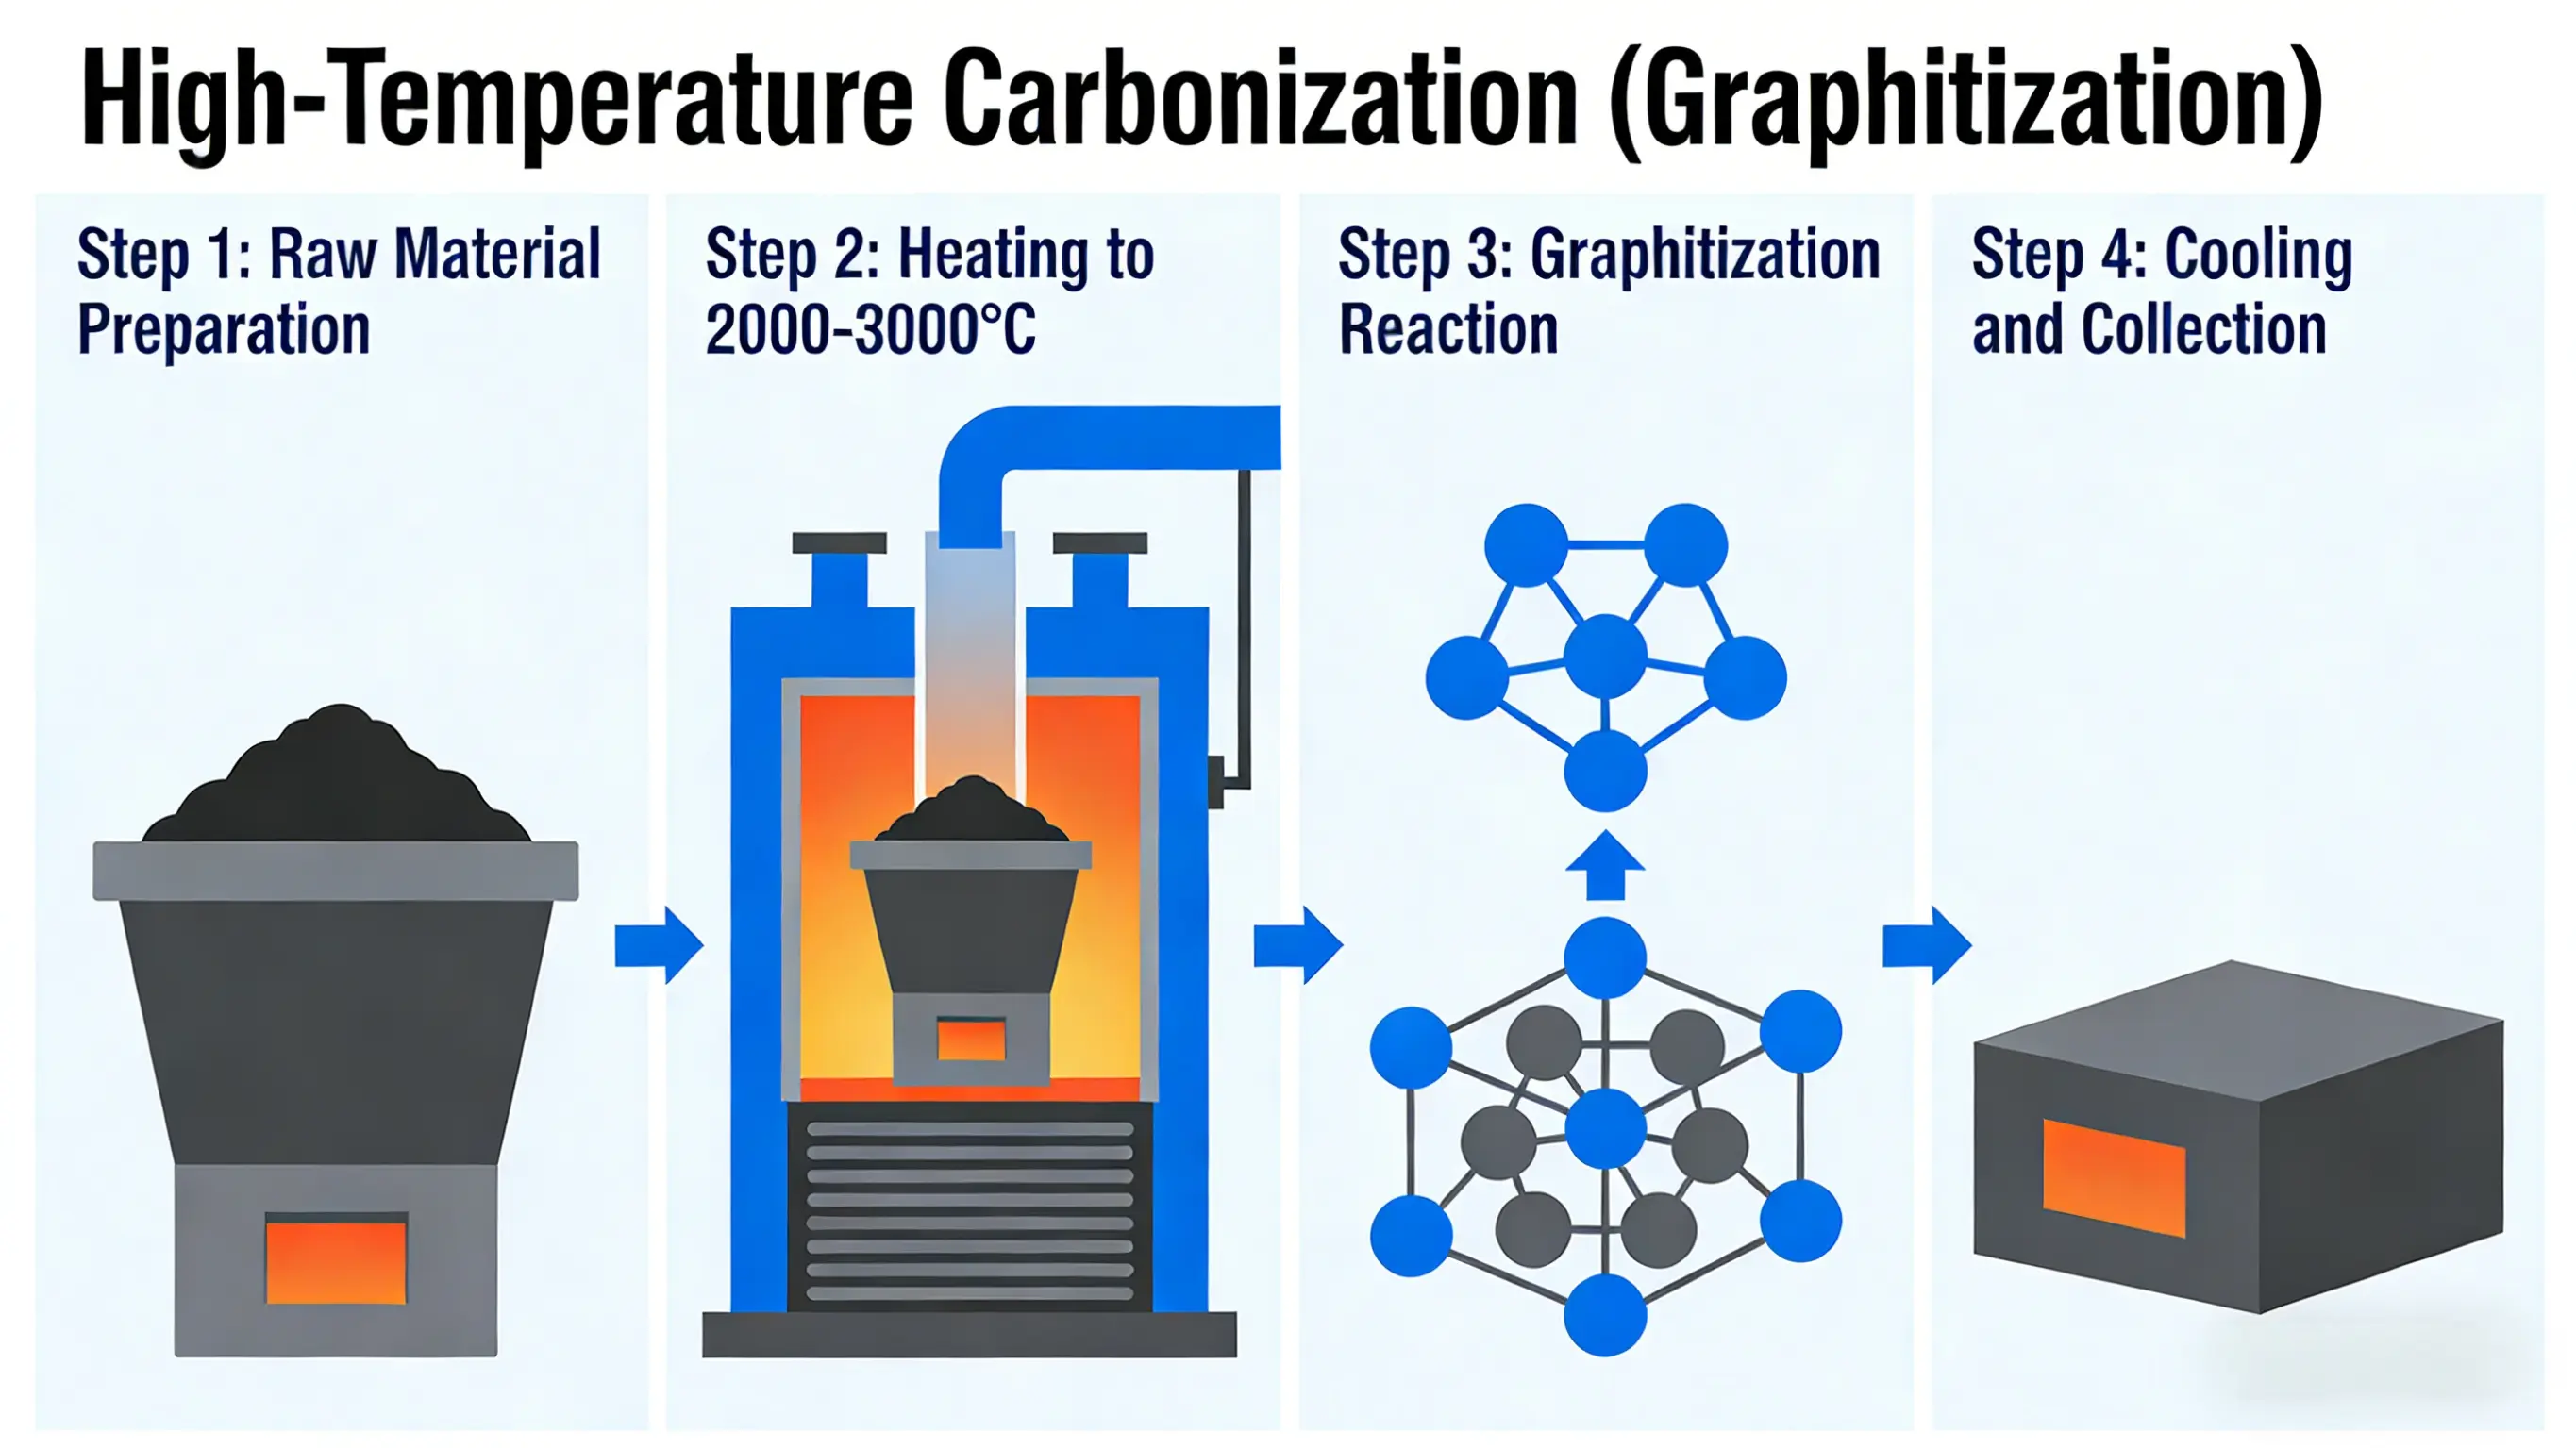
Standard carbonization stops at 1300°C. You get 93.85% carbon content. Works for some uses. Aerospace needs more.
Push the temperature to 2700°C. Carbon content hits 99.87%. Hydrogen and nitrogen drop below 0.05%. The fiber changes from messy carbon into neat graphite crystals. This step creates the performance you need.
Finding the Right Temperature
Most operations run between 2200–2600°C. Vacuum conditions stay at 100 Pa. Heat the fibers at 20°C per minute. Keep them at target temperature for 3 hours.
Old methods required 2800°C. New techniques fixed this. Add shear stress during heating. Or mix in catalysts like La₂O₃. Temperature drops to 2600°C. The catalyst improves microcrystal order. Lithium ions and electrons move faster through the material.
Some labs reach graphitization at just 1200°C under 5.0 GPa pressure. High pressure speeds up crystal growth. The d-value spacing between graphite layers gets smaller as temperature rises.
Reading the Data
Graphitization degree shows how ordered the carbon structure got. Test samples from mylonitized meager coal show clear progress:
At 2200°C: Graphitization hits 80.23% with d002 spacing of 0.3371 nm. This is semi-graphite level.
At 2600°C: The degree jumps to 88.37% with d002 at 0.3364 nm. True graphite range starts here.
Compare this to undeformed coal at the same temperatures. 2200°C reaches 51.16% graphitization. 2600°C gets to 56.98%. Still stuck at meta-anthracite stage.
Raman spectroscopy checks crystal quality. The ID1/IG ratio measures disorder. Lower numbers mean better structure. Fibers processed well at 2600°C show 0.16. Bad processing gives 2.29. The AD1/AG ratio works the same way: 0.14 versus 2.74.
Gas Diffusion Layers and Actual Products
LINQCELL makes gas diffusion layers graphitized at 1600°C and 2000°C. The gap matters for fuel cells and batteries. Higher temperature creates stronger crystallinity. XRD and Raman data both show tighter graphite structure at 2000°C.
Thermal tests between 1800–3000°C reveal vitrinite and inertinite behavior. At 3000°C, large graphite layers form. Inertinite builds better structure than vitrinite at each temperature.
Nail the graphitization process. Your fiber delivers the strength, stiffness, and conductivity that customers pay top dollar for.
Step 5: Surface Treatment – Enhancing Resin Compatibility
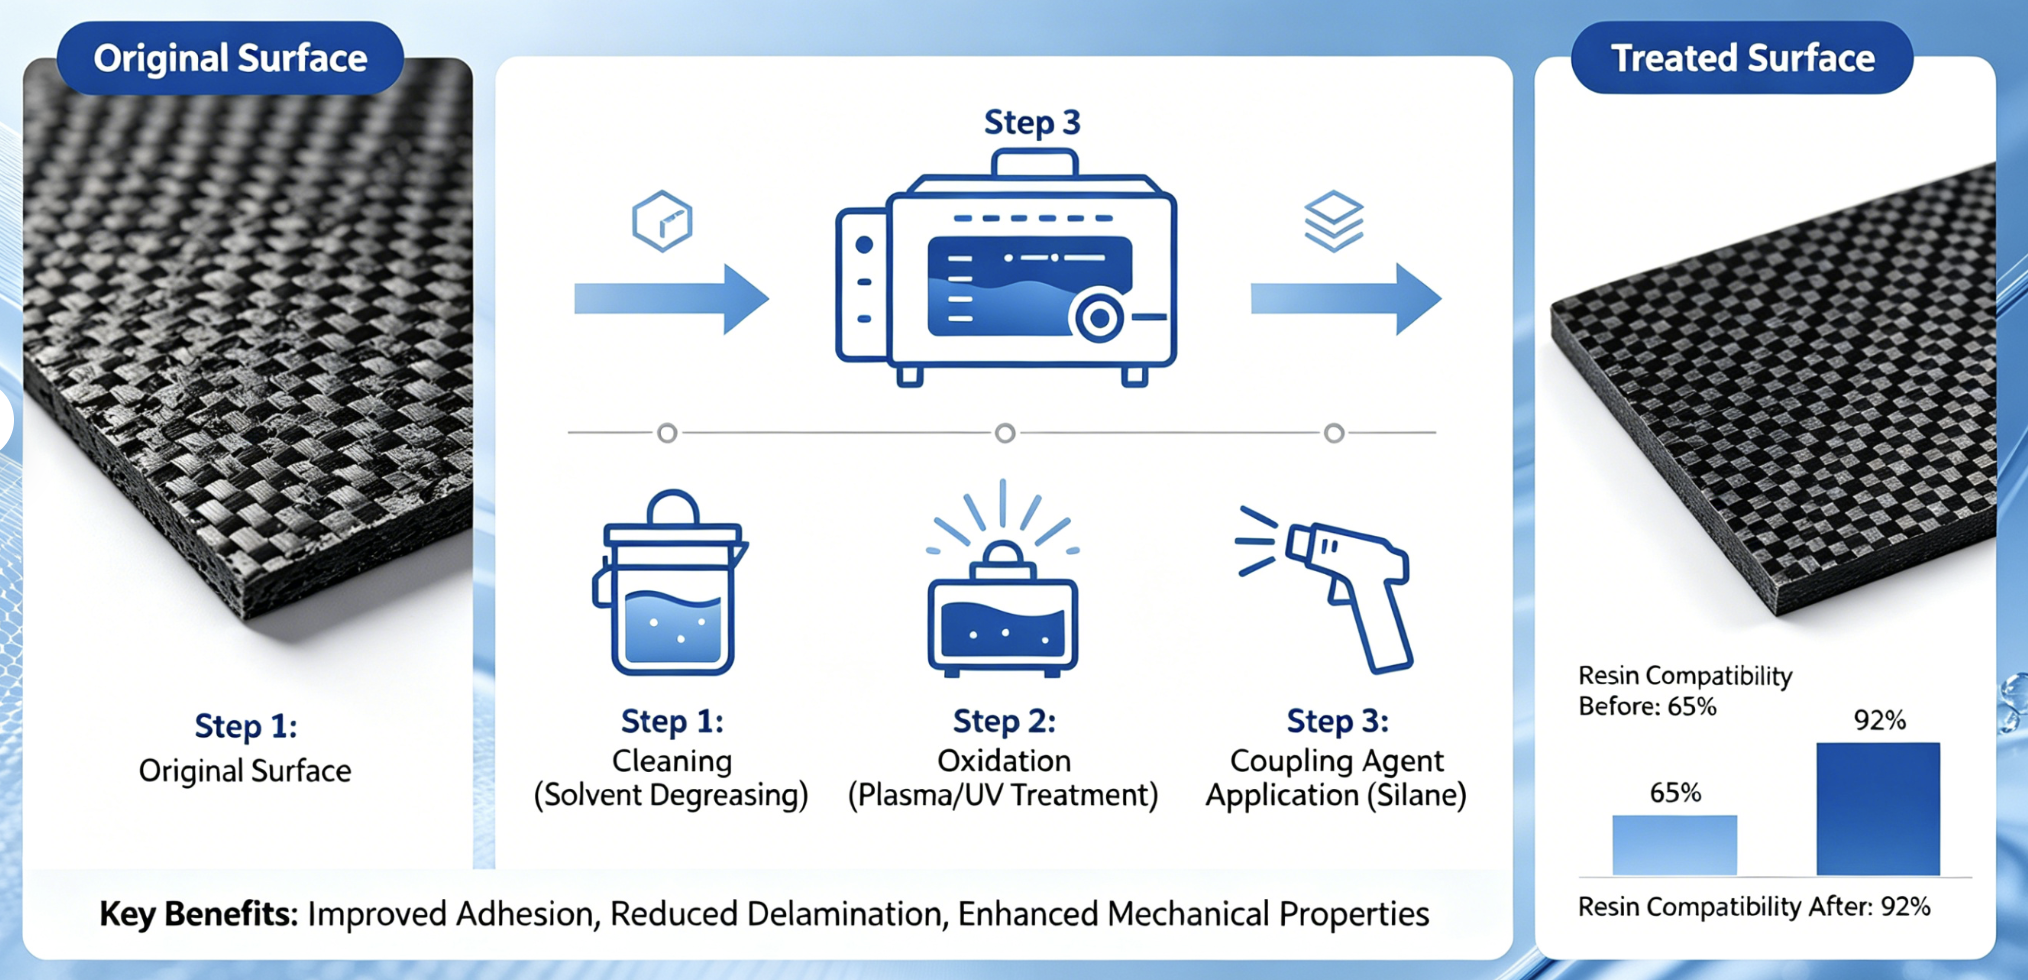
Fresh carbon fiber repels epoxy like oil repels water. The surface sits too smooth. Too inert. Resin slides right off during composite layup.
You need roughness and chemical hooks. Surface treatment adds both. This step decides if your composite holds together under load or falls apart on the first stress cycle.
Mechanical Roughening: Creating Physical Grip
Carbide burs cut grooves into fiber surfaces. These grooves give resin something to grip. Tests on aged composites show carbide treatment delivers 16.731 ± 4.006 MPa shear bond strength with Tetric EvoCeram resin.
Silica-coated aluminum oxide particles work even better for tiny-scale grip. Blast the surface and you create a textured layer. Shear bonds hit 16.635 ± 2.687 MPa. Both methods beat diamond bur treatment. They crush untreated controls in the data (P < 0.05).
The roughening pattern makes a difference. Carbide creates V-shaped grooves with sharp edges. Resin flows in and locks into place. Silica coating builds a porous surface layer. Tiny particles embed and create thousands of anchor points per square millimeter.
Failure mode testing proves the difference:
|
Treatment |
Mean Shear Bond (MPa) |
Composite Example |
Failure Type |
|---|---|---|---|
|
Carbide |
16.731 ± 4.006 |
Tetric EvoCeram |
Mixed (60-80%) |
|
Silica |
16.635 ± 2.687 |
Tetric EvoCeram |
Mixed (80%) |
|
Diamond |
Lower (varies) |
Various |
Adhesive (50%) |
|
Control |
Lowest |
Neo Spectra |
Adhesive (50%) |
Mixed failure means the bond held strong enough that cracks ran through both resin and fiber. Adhesive failure shows the bond failed first. You want mixed failure.
Chemical Coupling: Silane Application
Rough surfaces need chemical bridges too. Silane coupling agents solve this. One end bonds to carbon fiber hydroxyl groups. The other end bonds to resin molecules.
Research data ranks treatment combos for long-term repair strength on aged methacrylate composites:
Self-etch + silane post-diamond bur wins for shear: 38.87 MPa mean difference (95% CI 21.60-56.14, P-score 0.99). For tensile loads: 32.52 MPa (95% CI 23.74-41.29, P-score 0.73).
Total-etch + silane post-diamond bur ranks second: 32.35 MPa shear (95% CI 18.25-46.40, P-score 0.95) and 33.25 MPa tensile (95% CI 25.07-41.44, P-score 0.77).
The procedure works like this:
-
Roughen the fiber surface with carbide bur or silica-coated aluminum oxide particles
-
Clean with solvent to remove debris and oils
-
Add silane coupling agent – let it react for 60 seconds minimum
-
Use total-etch or self-etch adhesive primer
-
Add resin while surface stays active
Tests at 0.5 mm/min crosshead speed confirm this: mechanical plus chemical treatment beats mechanical alone. Silica or carbide combined with silane shows much higher shear bond versus diamond bur roughening (P < 0.05 across Tetric EvoCeram, Filtek Ultimate, Neo-Spectra St HV composites).
Surface Energy and Wetting
Treatment changes surface energy. Raw carbon fiber sits at 35-45 mN/m. Oxidative treatments push this to 60-72 mN/m. Higher surface energy gives you better resin wetting.
Drop a resin bead on untreated fiber. The Contact angle measures 85-95 degrees. The resin balls up. Treat the surface right and the contact angle drops to 15-25 degrees. The resin spreads flat.
Self-etch and total-etch adhesive systems show no difference in the data once you pair them with proper prep and silane. Pick whichever fits your process. Both work.
The key point: roughening creates retention sites. Silane builds chemical bridges. Together they give you bond strength that survives thermal cycling, moisture exposure, and repeated stress. Skip either step and your composite becomes a ticking time bomb.
Step 6: Sizing Application – Protecting Fibers and Making Them Easier to Handle
Raw carbon fibers coming off the graphitization line break easily. Handle them and they snap. They catch on machines. Static makes them clump together.
Sizing solves this problem. You coat each fiber surface with a thin polymer layer. This coating works as a temporary shield. It keeps fibers together during weaving and composite work. The coating washes off later for final bonding.
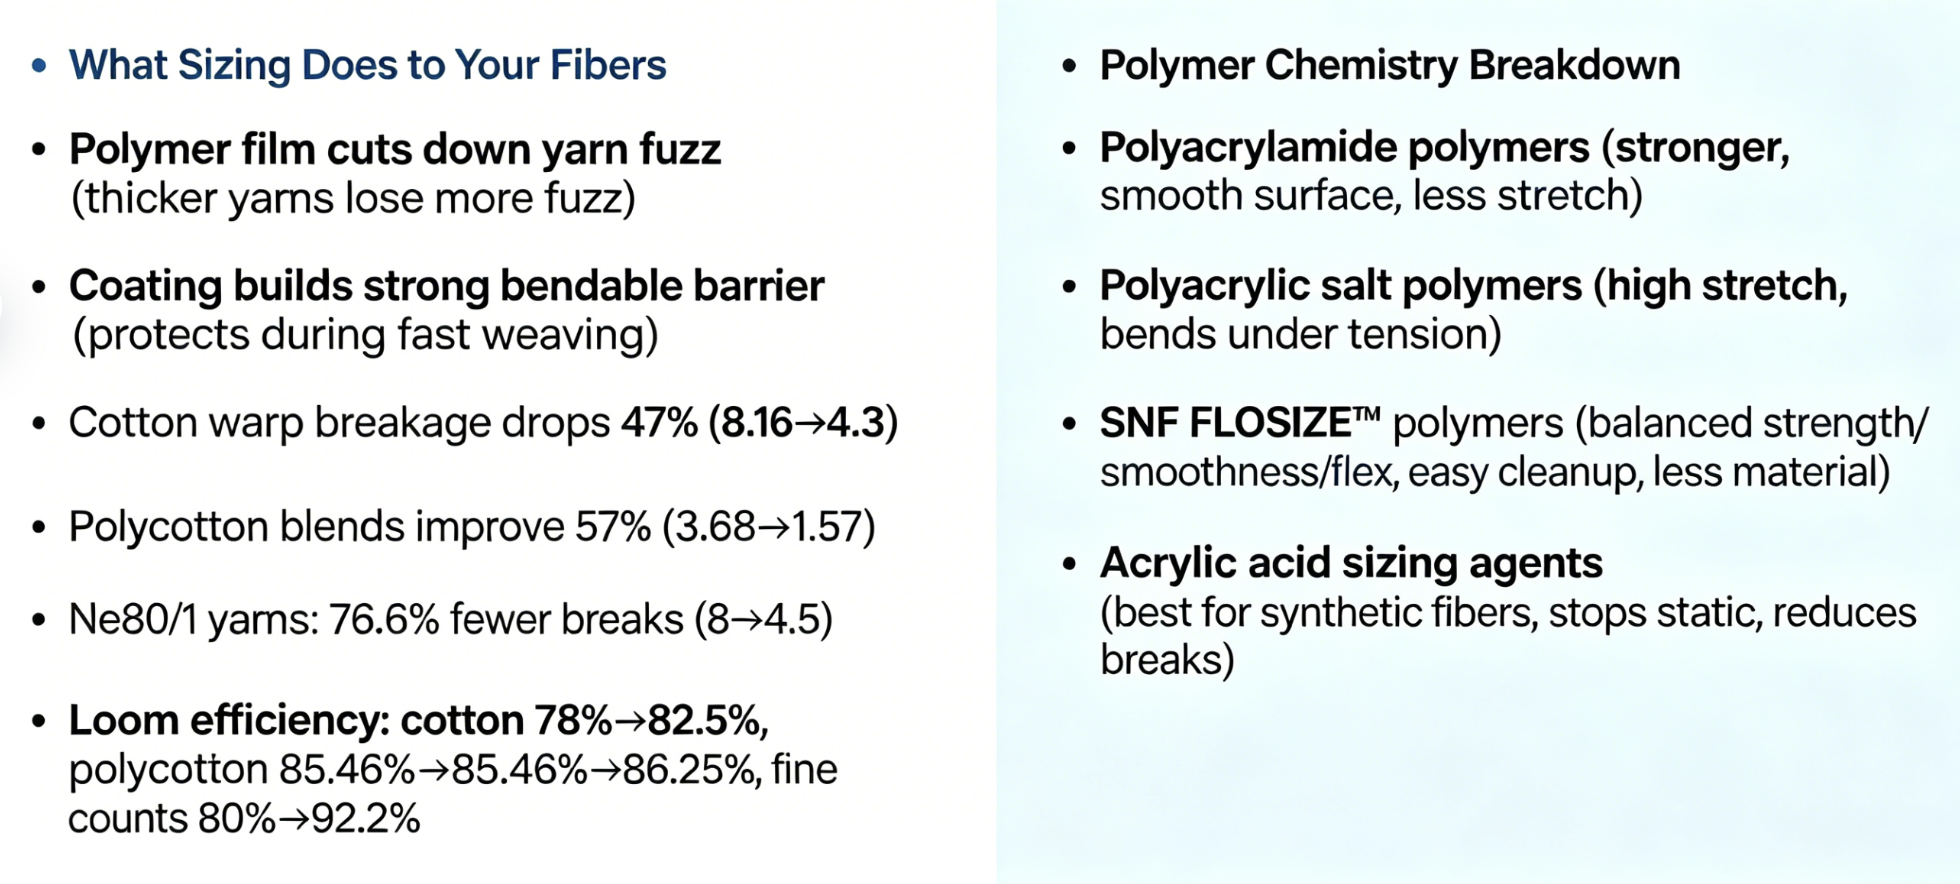
What Sizing Does to Your Fibers
The polymer film cuts down yarn fuzz on all fiber types. Thicker yarns lose more fuzz than thin ones. The coating builds a strong, bendable barrier. This protects fibers during fast weaving.
Cotton warp breakage drops 47% with modern polymers instead of PVOH sizing—from 8.16 breaks down to 4.3. Polycotton blends improve 57% (3.68 → 1.57 breaks). Fine count Ne80/1 yarns see the biggest jump: 76.6% fewer breaks (8 → 4.5 breaks).
Loom efficiency climbs across the board. Cotton operations jump from 78% to 82.5%. Polycotton moves from 85.46% to 86.25%. Fine counts make the largest gain: 80% to 92.2% efficiency.
Polymer Chemistry Breakdown
Each polymer type works differently:
Polyacrylamide polymers make sizing films stronger. They smooth yarn surfaces. The film doesn’t stretch much.
Polyacrylic salt polymers stretch a lot. The film bends instead of breaking under tension.
SNF FLOSIZE™ polymers balance strength, smoothness, and flex. They dissolve easily, making cleanup simpler later. You use less material per batch than old formulas.
Acrylic acid sizing agents work best on synthetic fibers—PET staple, polyester/cellulose blends, viscose filament. They stop static buildup and fuzz. Yarn holds together better. Breaks happen less often.
Picking the Right Mix
Type-2 sizing bath beats other mixes in weaving tests. Machine stops and warp cuts hit the lowest levels. Efficiency reaches 86.87%. Other mixes sit at 82.33%, 81.10%, and 79.91%.
Fuzz reduction changes based on yarn weight and bath type. 45 Ne yarn with type-2 bath shows 3.65% less fuzz. Fine yarns with the same bath deliver 3.95% reduction.
The Environmental Trade-off
Sizing agents cause 50-70% of COD load in textile wastewater. COD measures pollution in the water.
SNF polymer tests cut COD impact big:
– Cotton (PVOH replacement): 59% reduction
– Polycotton blend (first trial): 47% reduction
– Polycotton blend (second trial): 39% reduction
– Fine counts Ne80/1 dyed yarn: 58% reduction
Cost Reality Check
SNF polymers cost 30% more per unit than standard sizing. But you only need one-third the amount.
One mill did the math: sizing costs went up $30,000 per year. Better quality fabric and higher loom efficiency brought in about $95,000 per year. Net gain: $65,000.
Fabric flaws dropped in all areas—stop marks with uneven weft density, ladder effect, too much sizing.
Fiber-Specific Needs
Cotton takes 45% market share of textile sizing chemicals. Starch-based and PVA-based products are the standard choice for warp strength.
Synthetic fibers (polyester, nylon) grow fastest at 6.5% CAGR through 2033. They behave differently than natural fibers. Static becomes a problem. Less friction means you need special mixes. Fast weaving requires tougher products.
Blended yarns need sizing that works on different fiber types in the same thread.
Get sizing right and your carbon fibers survive handling. Skip it or pick the wrong mix and you lose material to breaks before it reaches the composite mold.
Energy Efficiency and Sustainability in Carbon Fiber Manufacturing
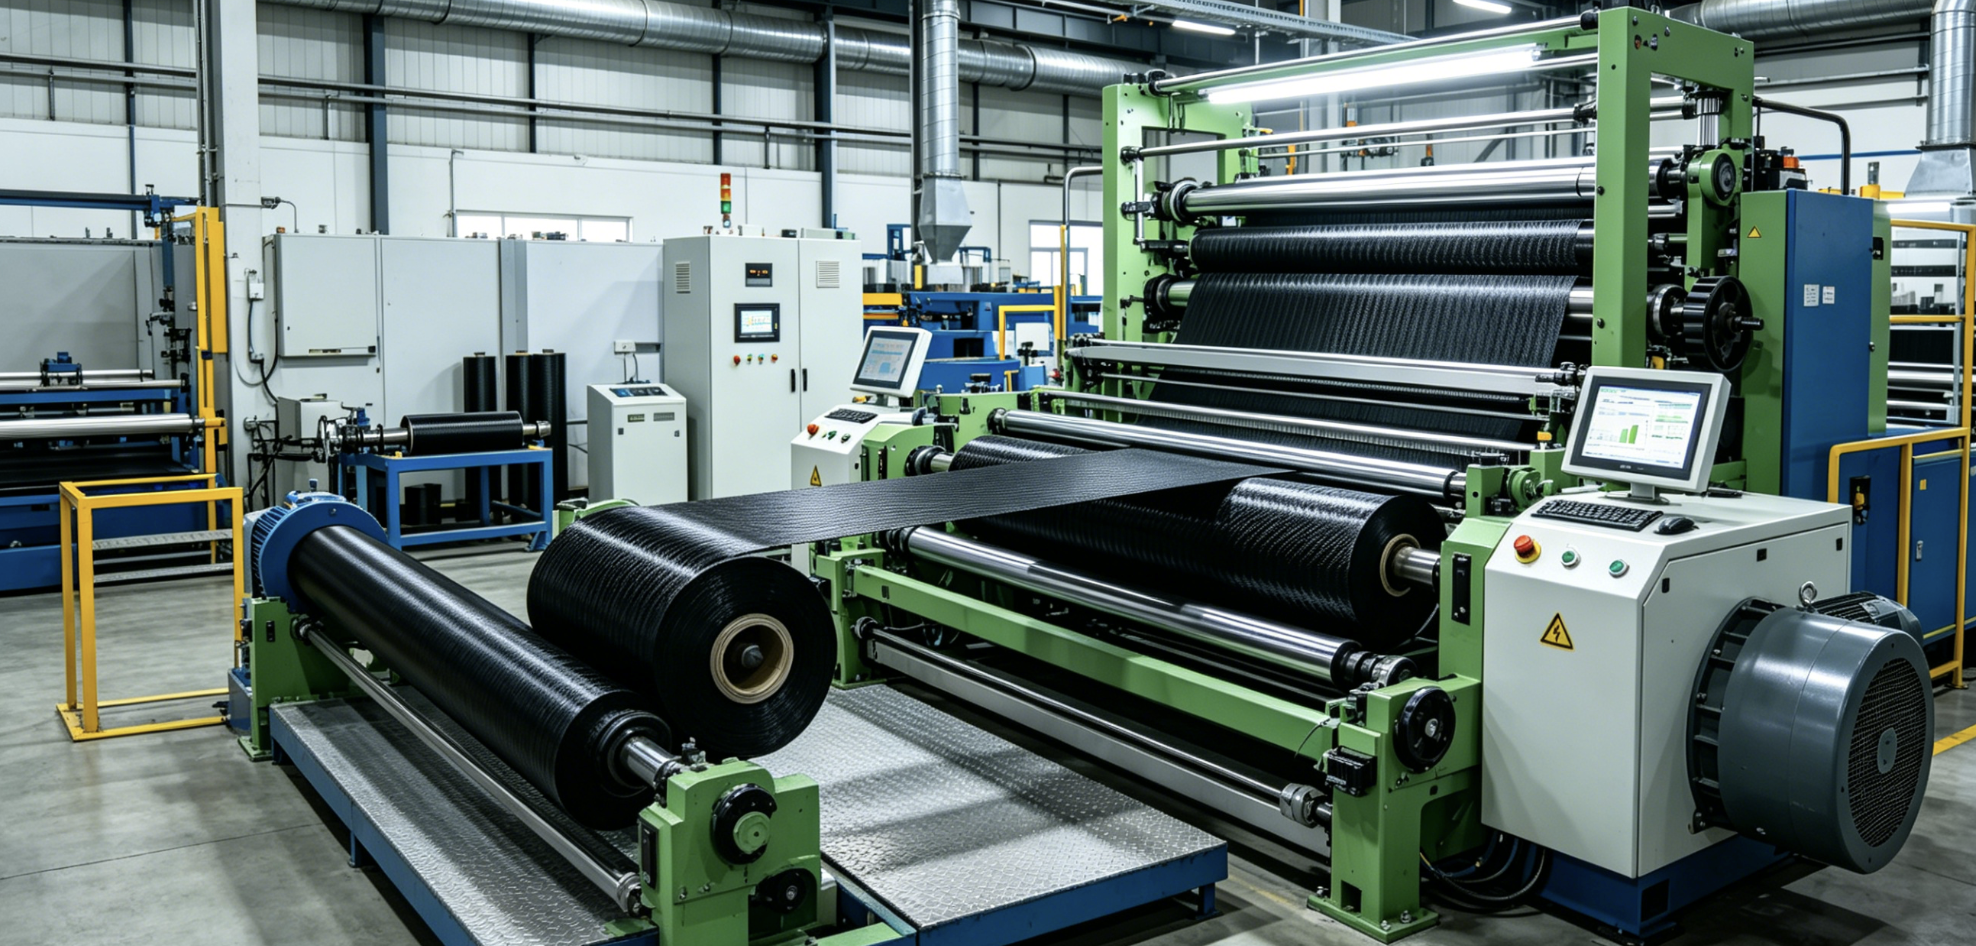
Each kilogram of carbon fiber needs 170 MJ of thermal and electric energy combined. That’s enough power to run your refrigerator for three weeks. The environmental cost? 13.0-34.1 kg CO₂ equivalent per kilogram of finished fiber. Energy use creates 59% of this climate impact.
The Material Loss Problem
Processing wastes half your starting material. You start with 1.95 kg of PAN precursor. You finish with 1 kg of carbon fiber. That’s 49% mass loss on average. The range sits between 41-55% based on your process controls.
Check how carbon content rises through each heating stage:
|
Stage |
Carbon (%) |
H (%) |
N (%) |
O (%) |
|---|---|---|---|---|
|
Stabilized PAN |
65 |
12 |
5 |
8 |
|
Carbonized (<500°C) |
67 |
19 |
11 |
3 |
|
Carbonized (<700°C) |
72 |
18 |
7 |
2 |
|
CF (~1500°C) |
>95 |
4.5 |
0.3 |
0.2 |
PAN precursor creates 37% of climate change impact. It uses 50% of fossil resources at 262.3-497.9 MJ/kg CF. The heating stages burn through what’s left.
New Tech Cuts Energy Fast
Plasma and microwave oxidation cut stabilization energy way down. Waste heat recovery preheats incoming air. This recycles thermal energy instead of releasing it. Low-pressure ovens with precise temperature control cut airflow needs. They also shorten process time.
OneJoon’s end-to-end airflow ovens cut equipment in half. You use half the fans. Half the burners. The design moves air evenly through PAN during oxidation. Energy use drops compared to old center-to-end systems.
Carbon-MX microwave processing beats fossil fuel systems by big numbers: 70% less energy, 90% shorter heating time, 80% smaller factory footprint. Against standard electric lines, it still saves 50% energy.
Corebon’s induction heating cuts energy use by 50-80%. Heat spreads evenly. Cooling goes faster. Cycle time for an automotive hood drops from 15 minutes to 8 minutes.
Alia Mentis built a process that uses 40% less material and 90% less energy for Class A CFRP parts. The parts meet Automotive surface quality standards.
Real Savings Add Up
Switch to renewable power. Optimize your tech. You cut emissions 26-47% across the production chain. The lifecycle numbers look good for vehicles. Make a car body 30% lighter with CFRP. That saves 50 tons of CO₂ per ton of carbon fiber over ten years of driving. The production emissions get paid back through fuel savings.
Conclusion
Carbon fiber manufacturing turns basic PAN precursor fibers into aerospace-grade materials. The process controls oxidation, carbonization, and surface treatment precisely. Looking at PAN-based carbon fiber for structural uses? Or checking out pitch-based carbon fiber options? Know each step—from fiber tensioning to sizing—and you’ll make better choices about composite manufacturing partners and in-house production.
Good fiber alignment separates average composites from critical parts. We’ve covered current best practices here. But carbon fiber technology keeps moving forward. What’s your next step? Match your performance needs to these manufacturing factors. Need 650 GPa modulus? High-temperature carbonization is what you want. Surface bonding matters most? Surface treatment becomes your key control point.
Want carbon fiber that fits your exact specs? Contact our team at HyperX Carbon. We’ll discuss how our manufacturing know-how creates real performance gains for your application. Understanding the process is just the start. Choosing the right manufacturing partner? That’s what makes the difference.
Contact HyperX Carbon – Your Trusted Chinese Carbon Fiber Customization Partner
Ready to develop high-performance carbon fiber materials or custom forged carbon fiber parts tailored specifically for your project?
HyperX Carbon is your long-term strategic partner with over 20 years of expertise in advanced composites. We specialize in delivering aerospace-grade forged carbon fiber custom solutions, along with fully personalized prepreg, tubes, sheets, and lightweight carbon fiber structural components for automotive, drone, eVTOL, and medical applications.
We don’t just supply materials — we provide end-to-end customization support:
-
Stable premium supply chain using Toray, Mitsubishi, and Hengshen raw materials
-
AS9100D certified production tailored for aerospace and UAV requirements
-
Rapid prototyping carbon fiber component in just 5-8 weeks, with monthly capacity over 180,000 parts
-
Competitive pricing with 15-18% cost savings on forged carbon solutions
-
Full customization flexibility: from T700 and T1100G to ultra-high modulus grades, with tailored layups, finishes, and performance specifications
Whether you’re an eVTOL developer, automotive OEM, drone manufacturer, or medical device engineer, HyperX Carbon delivers bespoke material selection, structural optimization, and manufacturing solutions that match your exact technical and performance needs — with consistent batch-to-batch quality and reliable delivery.
Get in touch today for a free technical consultation, personalized quote, or custom material samples.
📧 Email: [email protected] 🌐 Website: https://www.hyperxcarbon.com/ 📞 Phone/WhatsApp: +86 15623270276 (English support available)
Let’s co-create your next lightweight innovation together. Contact HyperX Carbon now and stay ahead in the low-altitude economy and advanced composites market.
HyperX Carbon – Not just a supplier, but your dedicated carbon fiber customization expert.