Why Precision Matters: Beyond the Basics of Carbon Fiber Manufacturing
Let’s be honest: finding reliable, shop-floor-ready data on manufacturing carbon fiber rectangular tubes is frustrating. Most engineers find themselves stuck in a “knowledge gap”—caught between basic YouTube tutorials and expensive academic textbooks that are too theoretical for real-world production.
But on the factory floor, theory doesn’t stop parts from warping. A simple oversight in fiber orientation or a 5°C drift in curing temperature doesn’t just mean a rejected tube; it means thousands of dollars in wasted prepreg and missed deadlines. When you are replacing aluminum with carbon fiber, you aren’t just changing materials; you are changing your entire engineering mindset.
This guide bridges that gap. It isn’t just about how to make a tube; it’s about how to make a profitable one. Whether you are evaluating the ROI of a $500k pultrusion line or trying to fix resin voids in a prototype batch, we cover the specific engineering controls and financial realities needed to succeed. From selecting the right modulus grade to nailing your final inspection, here is your step-by-step roadmap to manufacturing aerospace-grade structural profiles. You can browse our range of standard carbon fiber rectangular tubes available in stock, or read on to understand how we make them.
Compression Molding Method: SM vs. HM Carbon Fiber Grades
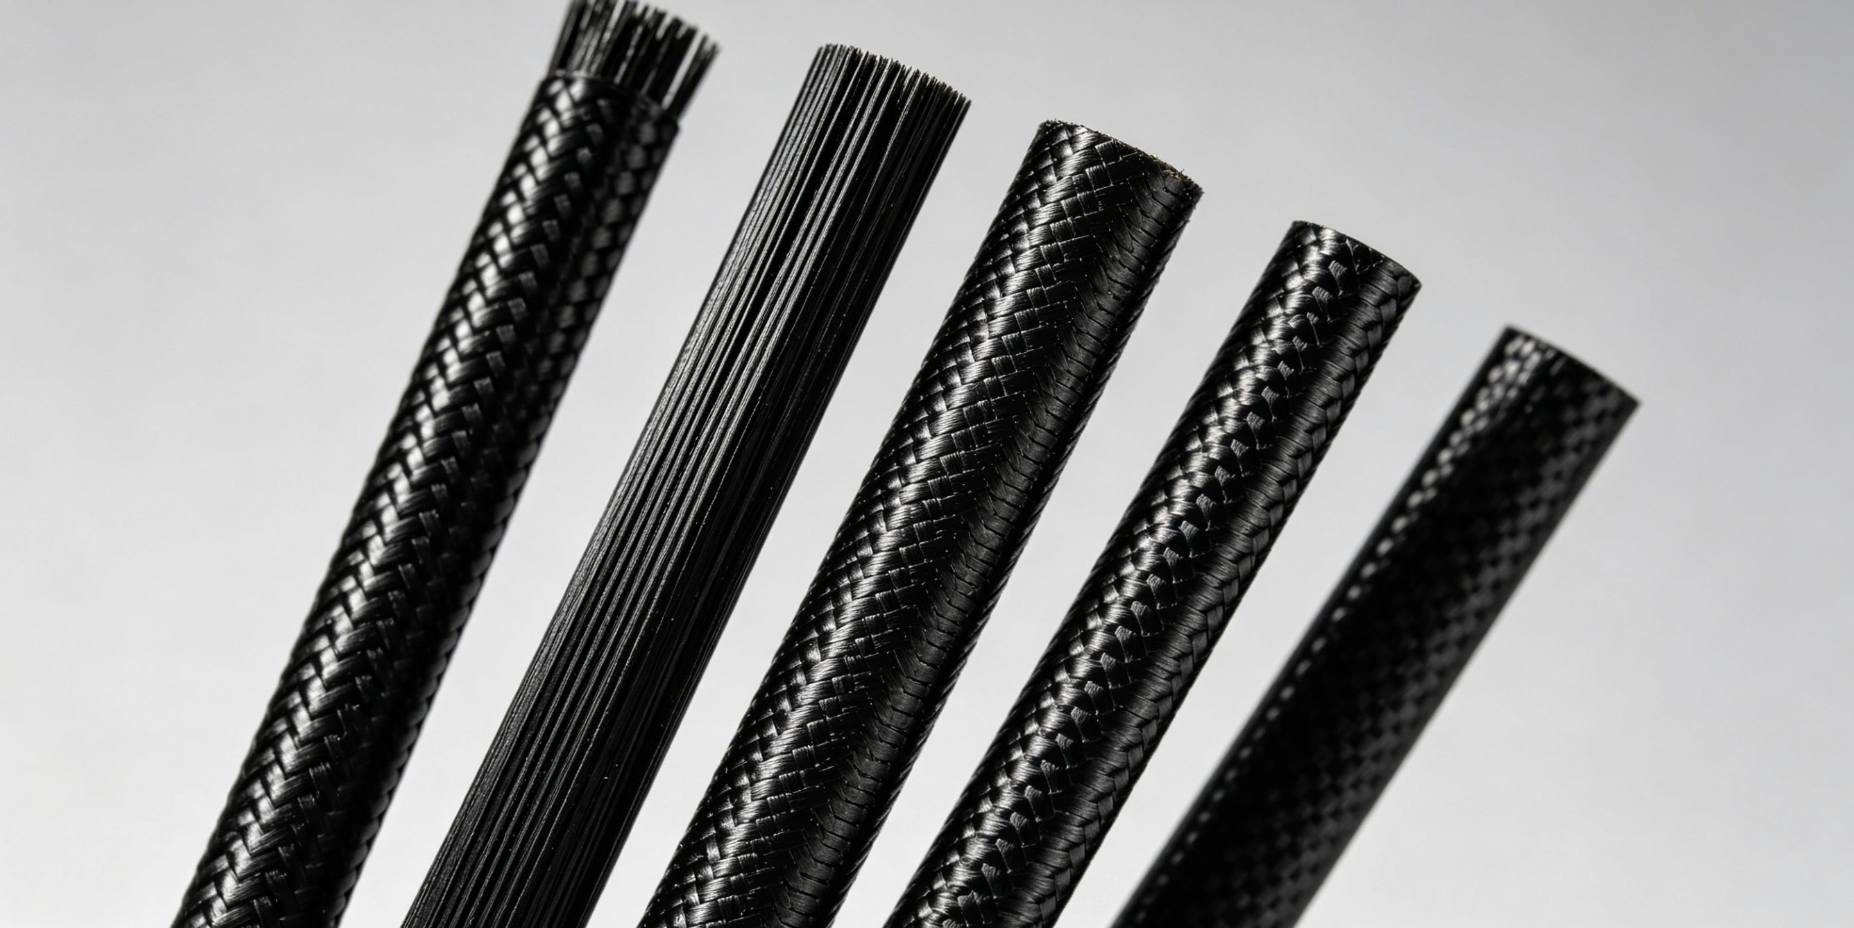
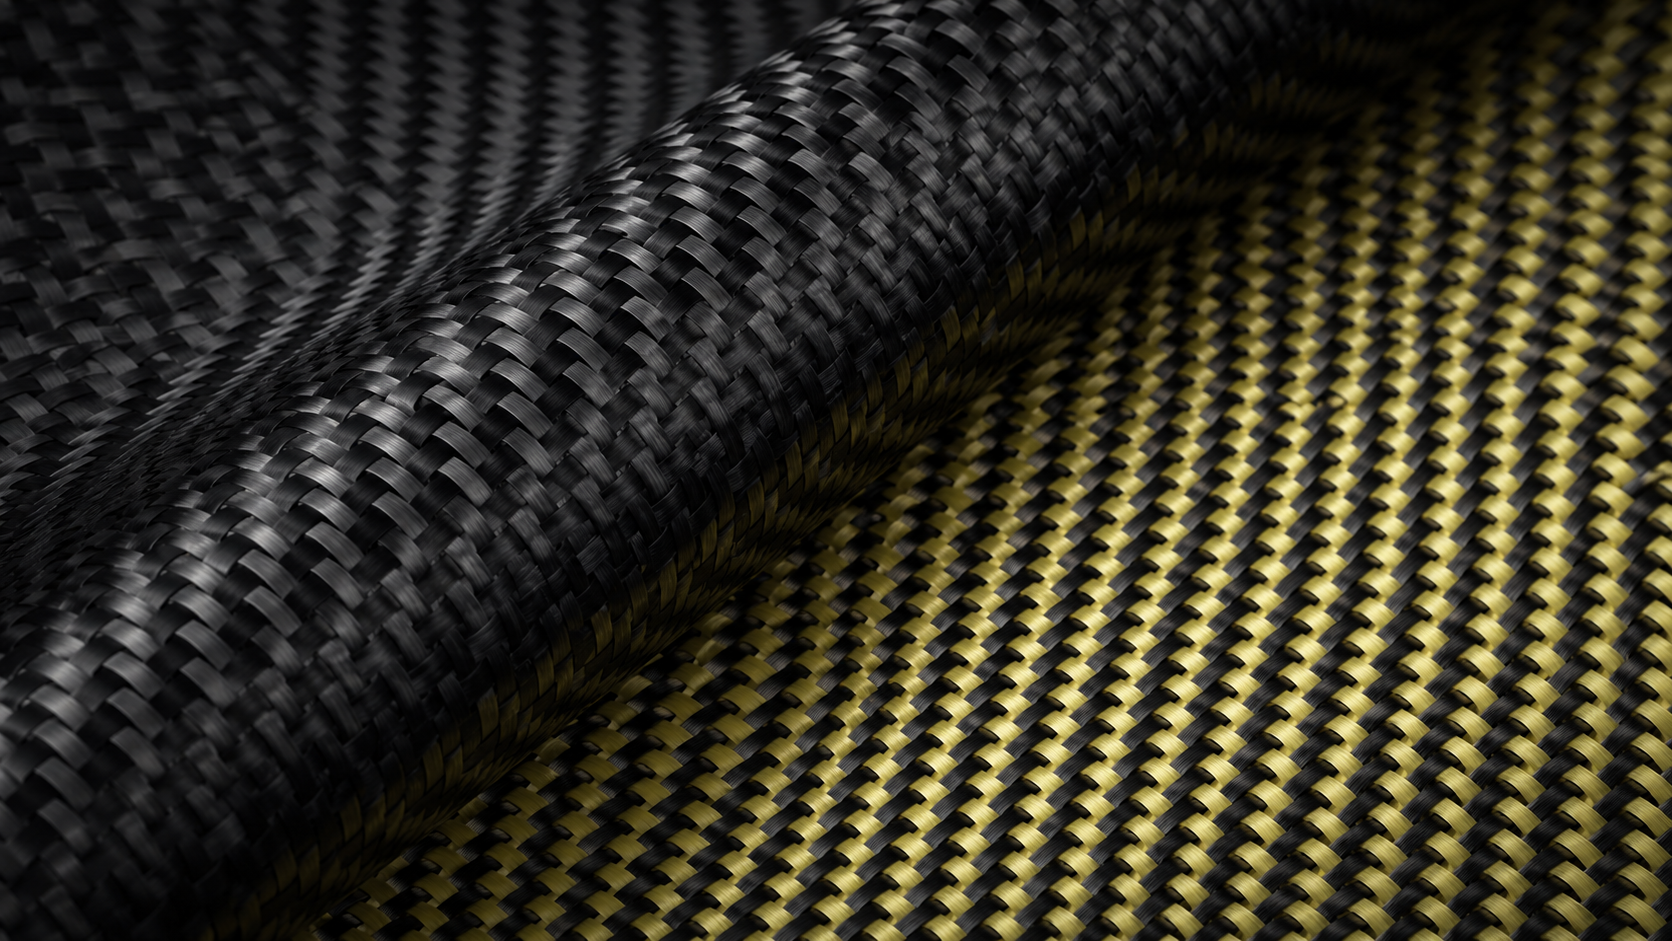
Carbon fiber rectangular tubes cut weight by 40-70% compared to aluminum. They also bend less under load. A standard 72 × 1 × 2 inch tube weighs just 1.62 lbs—about 60% the weight of similar metal tubes. This strength comes from the material makeup: 100% high-strength carbon fiber prepreg mixed with epoxy resin. Many have a twill weave outer layer.
Fiber direction controls how the tube performs. Most makers layer fibers in several directions. They use 0° axial plies for bending stiffness. Then they add 90° hoop plies. Got torsional or side loads? Braided plus unidirectional fabrics stop the cracking that breaks single-direction designs. These hybrid builds reach tensile strength of 640 ksi and a modulus of elasticity at 34 Msi.
Selecting the Right Carbon Fiber Grade
| Type | Stiffness (Tensile Modulus) | Tensile Strength | Best For / Typical Applications | Cost Factor | Key Characteristics & Trade-offs |
|---|---|---|---|---|---|
| Standard Modulus (SM) | 33 MSI (230 GPa) | ~500 ksi (3.5 GPa) | General industrial, Sporting goods, cosmetic parts | $ (Lowest) | Highest cost-performance ratio. Balanced stiffness & strength. Easy to process, ideal for high-volume production. |
| Intermediate Modulus (IM) | 42 MSI (290 GPa) | 500–650 ksi (3.5–4.5 GPa) | Performance automotive, UAV spars, structures needing balanced stiffness & strength | $$ | Excellent overall balance. Noticeably higher stiffness than SM while retaining good strength. |
| High Modulus (HM) | 45–55+ MSI (310–380+ GPa) | ~400 ksi (≈2.8 GPa) | Aerospace, satellite structures, precision components requiring maximum stiffness | $$$ | Extremely high stiffness. More brittle, lower impact resistance. Not suitable for high-load shock applications. |
| Ultra-High Modulus (UHM) | 65–135 MSI (450–930 GPa) | Low (significantly reduced) | Specialized space applications, robotics arms, zero-deflection critical structures | $$$$$ | Top-tier stiffness (minimal deflection). Very brittle. Limited to extreme low-deformation scenarios only. |
| High Strength (HS) | Standard (~33 MSI) | >700 ksi (>4.8 GPa) | Pressure vessels, impact zones, safety cages, high-impact/tensile-critical parts | $$ | Superior tensile strength & toughness. Excellent for energy absorption and extreme load-bearing. |
Match your load type to the layup strategy. Need maximum axial stiffness for UAV spars? Go with 0° plies. Building automation frames that fight torsion? Use braid/UNI combos. Wall thickness affects both weight and strength. Thin walls save weight. Thicker sections carry heavier loads.
The making process changes accuracy and cost. Roll-wrapped tubes give you custom diameters and shapes. They use multiple prepreg layers and high-temp curing. Compression molding gives tighter tolerances. It also costs less. Check your volume and precision needs. Then pick the right process before you lock in material specs.
Compression Molding Method: Step-by-Step Manufacturing
Looking for tight tolerances? Learn more about our custom compression molding services for high-precision components.
Compression molding turns raw materials into exact rectangular tubes. Heat and pressure do the work. Start with mold making—steel or aluminum cavities cut to your tube size. CNC machines give you factory-level accuracy. Need prototypes fast? 3D-printed molds using Formlabs SLA Clear Resin handle small batches. Die casting works for big production runs.
Clean your molds first. Put release agents on every surface. Heat them to the resin’s curing temperature. Do this before you load material. This prep stops 60% of demolding problems.
Here’s how to make the tube: Put your fiber-reinforced resin into the open cavity. Position it right. Bad placement creates empty spots or extra flash. This wastes material and adds trimming time. Close the mold. Hydraulic pressure pushes material into every corner.
Keep pressure on during curing. Heat-setting resins need steady heat—from hot air or infrared—for minutes to several hours. Wall thickness and resin type decide the time. Thick-walled tubes take longer. Watch your control system. It tracks temperature, pressure, and time closely.
Standard cycles run 1-5 minutes for thin sections. Thick aerospace tubes can take up to an hour. After curing finishes, cool the mold. Open it. Pull out your tube. Trim the flash—the thin extra material squeezed past the mold edges.
Last steps are cleaning and checking. Measure against your specs. This method gets tighter sizes than hand layup or filament winding. Manufacturers pick compression molding for this reason. You get better accuracy, even if costs run higher.
Pultrusion Process: Cost-Effective High Volume Manufacturing
Pultrusion combines fiber reinforcement with automated precision. The process pulls pre-tensioned fibers through heated dies. This creates uniform cross-sections without stopping. Your rectangular tubes come out with 60-75% fiber volume fraction—higher than most hand layup jobs. Carbon fiber runs at 60-70%. Glass fiber pushes to 70-75%.
Line setup drives your output quality. Fiber spools feed rovings under controlled tension—10-50 N per roving. Keep variation under 5%. Misaligned fibers create weak spots. These fail testing. Position accuracy stays within ±1 mm. Feed rate control holds at ±2% variance.
Fibers pass through a resin bath or injection chamber. Modern systems pump 1-20 L/min with pressure accuracy to 0.1 bar. Multi-stream injection systems prevent voids. Degassing systems do the same. These voids often ruin cheaper setups. The wetted fibers enter pre-forming guides. These shape the material before the heated die.
Die temperature cures the resin. Pulling systems keep steady movement. Production speeds run 1-5 m/min for structural profiles. Thinner sections move faster—up to 5 m/min for thermoplastic composites. Pulling force ranges 5-50 kN based on profile size and die friction. Speed accuracy holds at ±1% of set point.
Two puller types handle different needs. Continuous pullers use synchronized belts for high-speed constant sections. Reciprocating pullers work 1-2 meter strokes in 10-60 second cycles. Need complex shapes or variable rates? Pick reciprocating systems. Grip pressure adjusts 1-10 bar to match material properties.
Cross-sectional accuracy hits ±0.1-0.2 mm—tighter than compression molding for constant profiles. Length runs unlimited. Shipping constraints are your boundary. Property variation stays within ±2% across the entire run.
The economics favor volume production. Energy use drops to 3.1 MJ/kg. Compare that to autoclave processing at 21.9 MJ/kg or RTM at 14.9 MJ/kg. Production costs fall to $1.00-$3.00 per unit at high volumes. Labor and energy expenses stay low.
Cost savings reach 40-60% less than filament winding. You save 60-80% versus hand layup at annual output above 1,000 meters. Initial investment runs $50,000-$500,000 based on tooling complexity. Break-even hits at 1,000 meters per year.
The pultrusion equipment market shows where manufacturing goes. Market size reached $1.2 billion to $3.9 billion in 2024 based on segment analysis. Pultruded products alone hit $3.169 billion. Machinery totaled $5.67 billion. Forecasts show growth to $2.5-$10.01 billion by 2033 at 6.52-9.2% CAGR. Product markets project $6.81 billion by 2034 (7.94% CAGR) and $6.3-$7.346 billion by 2035 (7.8% growth rate).
This process gives strength-to-weight ratios 2-4x better than steel. Aerospace, automotive, and infrastructure projects drive demand higher each year. Need consistent rectangular tubes at scale? Pick pultrusion. Your per-unit costs drop as volume climbs. Setup costs pay back fast once production stabilizes.
Alternative Methods: Roll-Wrapping and RTM for Special Requirements
Roll-wrapping turns heated prepreg into seamless tubes. You get mechanical precision. The mandrel works as your mold—a cylindrical core wrapped with carbon fiber prepreg layers. Hot and cold pressing rollers compress and shape the material as it feeds through. Each roller pair reduces spacing step by step. This gradual change prevents fiber buckling that ruins hand-wrapped tubes.
Rock West Composites keeps thousands of mandrels in-house. Stock sizes cover most rectangular and cylindrical profiles. Custom mandrels handle special dimensions. The process runs non-stop for unlimited lengths. Your production stops when you cut to size. Rods, tubes, I-beams, and hollow profiles all use this method. Need hybrid strength? Combine roll-wrapping with pultrusion for FRP profiles. These carry axial and torsional loads.
Resin Transfer Molding (RTM) fills a different gap. Load dry fiber preforms into closed mold cavities. Fiberglass or carbon fiber both work. Clamp the mold under hydraulic force. Inject catalyzed resin at high pressure through a mix head. Modern MPG valves prevent leaks and VOC emissions. Older systems had trouble here.
Production rates show the tradeoff. Standard RTM pushes 10-12 molds per 8-hour shift using gel coat and non-heated molds. Snap-cure resins speed cycles at room temperature. Light RTM (LRTM) drops to 4-6 molds per shift. Lower injection pressure makes the difference. LRTM handles foam cores as light as 37 kg/m³. Standard RTM needs denser cores—≥80 kg/m³—to survive injection forces.
Resin viscosity controls flow quality. Keep it at 0.2-0.8 Pa•s during processing. Too thick? Dry spots form. Too thin? Resin bleeds through fibers before cure starts. Adjust temperature to fine-tune viscosity in real-time.
Pick RTM for complex near-net shapes. One-step impregnation cuts the multi-step waste of hand layup. Peripheral injection builds higher edge rigidity. This stops the edge warping that plagues open-mold methods. Automation runs high. Loading, injection, and demolding all adapt to robotic systems.
Roll-wrapping works best for continuous cylindrical profiles with prepreg precision. RTM takes over for complex rectangular shapes that need controlled fiber placement. Your part shape and production volume decide which method cuts costs without losing strength.
ROI Calculation: How to Lower Your Cost Per Unit
Understanding the financial landscape of carbon fiber tube manufacturing is just as critical as the engineering. Manufacturing costs typically fall into a “U-shaped” curve based on volume. Smart manufacturers align their equipment tiers with production goals to optimize their Return on Investment (ROI).
Equipment Investment Tiers: Matching Scale to Spend
| Investment Tier | CapEx Range | Target Annual Volume | Typical Equipment & Setup | Break-Even Point (vs. Outsourcing) | Key ROI Drivers & Risks | Estimated ROI Horizon (Payback) |
|---|---|---|---|---|---|---|
| Prototype / Job Shop | $15,000 – $75,000 | 10 – 100 units/year | Manual mandrels, vacuum bagging, small convection ovens, hand lay-up | 200–300 units | • Lowest entry barrier • Very high labor cost per unit • Flexible for custom/low-volume • Risk: Extremely slow scaling | 1–2 years (at 150–300 units/year) |
| Mid-Volume | $200,000 – $800,000 | 500 – 5,000 units/year | Compression molding presses (e.g. 200-ton), heated steel dies, semi-automated resin systems | 2,000–3,000 units | • Good balance of automation & flexibility • Tooling amortization becomes meaningful • Risk: Bottlenecks if demand exceeds 5k units | 1.5–3 years (at 2,500–4,000 units/year) |
| Mass Production | $1.2M – $5.0M+ | 10,000+ meters/year | Automated pultrusion lines, continuous resin baths, real-time QC sensors, robotic trimming | 20,000+ meters/year (stable orders) | • Lowest cost per meter at scale • High fixed cost → requires long-term contracts • Highest efficiency gains (up to 75% output/hour increase) • Risk: Under-utilization kills ROI | 2–4 years (at 25,000–50,000 meters/year) |
Efficiency Optimization Frameworks
Once production starts, margins are made in the efficiency gaps. Implementing Value Stream Mapping (VSM) can reduce setup times drastically—one manufacturer cut pultrusion changeovers from 45 minutes to just 12 minutes.
Combined with Just-In-Time (JIT) inventory for prepreg materials (which have a short shelf life of 6-12 months), companies can reduce material waste by 8-12%. Remember, holding $50,000 in expiring resin isn’t an asset; it’s a liability waiting to be written off. Automation at the mass-production tier, such as robotic trimming, finds further margins by stabilizing labor costs and increasing output per hour by up to 75%.
Not sure which investment tier fits your project? Request a quote today, and our engineers will help you calculate the exact manufacturing costs for your specific volume.
Quality Control Master Guide: Detect, Diagnose, and Solve
In composite manufacturing, the First Pass Yield (FPY) is the dividing line between a profitable operation and a money pit. Aerospace leaders target 95%+ FPY. If you are sitting below 85%, you aren’t just losing material; you’re losing machine time and customer trust.
1. Analysis Methodologies: How to Find the Root Cause
Don’t just fix the symptom; fix the system. When a defect spike occurs, use these two proven tools:
- The “Five Whys” Technique: If a tube has resin-starved spots, ask why until you hit the process failure. (e.g., Starved spots -> Pump rate low -> Settings drifted -> No calibration schedule -> Root Cause: System missing preventive maintenance protocol).
- Pareto Analysis: The 80/20 rule applies to defects. Often, just 3 or 4 alarm codes cause 80% of your downtime. Identify these “vital few” issues and solve them first to see immediate jumps in uptime.
2. Common Defects and Engineering Solutions
We have categorized the most frequent failures in rectangular tube manufacturing and their direct fixes:
- Voids & Porosity:
- Identification: Tiny holes or dry spots in the matrix.
- Root Cause: Low injection pressure, trapped air, or humidity in resin.
- Corrective Action: Increase consolidation pressure; check vacuum bag integrity; use degassing systems for resin.
- Fiber Misalignment:
- Identification: Wavy fibers or wrinkling in corners.
- Root Cause: Uneven tension during pulling/rolling; fast cure ramp-up.
- Corrective Action: Adjust creel tension (keep variation <5%); slow down initial heat ramp to allow settling.
- Dimensional Drift:
- Identification: Wall thickness variation or warping.
- Root Cause: Tool wear; thermal expansion mismatch; unstable cure temp.
- Corrective Action: Verify mold dimensions; use real-time laser monitoring; implement stricter temperature control loops.
- Micro-cracking:
- Identification: Small cracks visible under magnification.
- Root Cause: Thermal shock; coefficient of thermal expansion (CTE) mismatch.
- Corrective Action: Optimize the cool-down cycle; ensure resin toughness matches application stress.
3. Defining Metrics: The Cost of Quality
Tracking the right numbers drives behavior. Monitor your Defect Density (Defects ÷ Units Produced). A reliable process should stay below 300 PPM for industrial parts and near-zero for aerospace.
Crucially, watch your Escape Rate (defects that reach the customer). A high escape rate means your final inspection is failing. Adding redundancy, such as ultrasonic testing alongside visual checks, can drop escape rates from 5% to under 2% rapidly. Remember, a defect caught in the mold costs $50; a defect caught by the customer costs $50,000 in reputation and warranty claims.
Manufacturing Process Selection Matrix: Matching Technique to Production Volume and Geometry
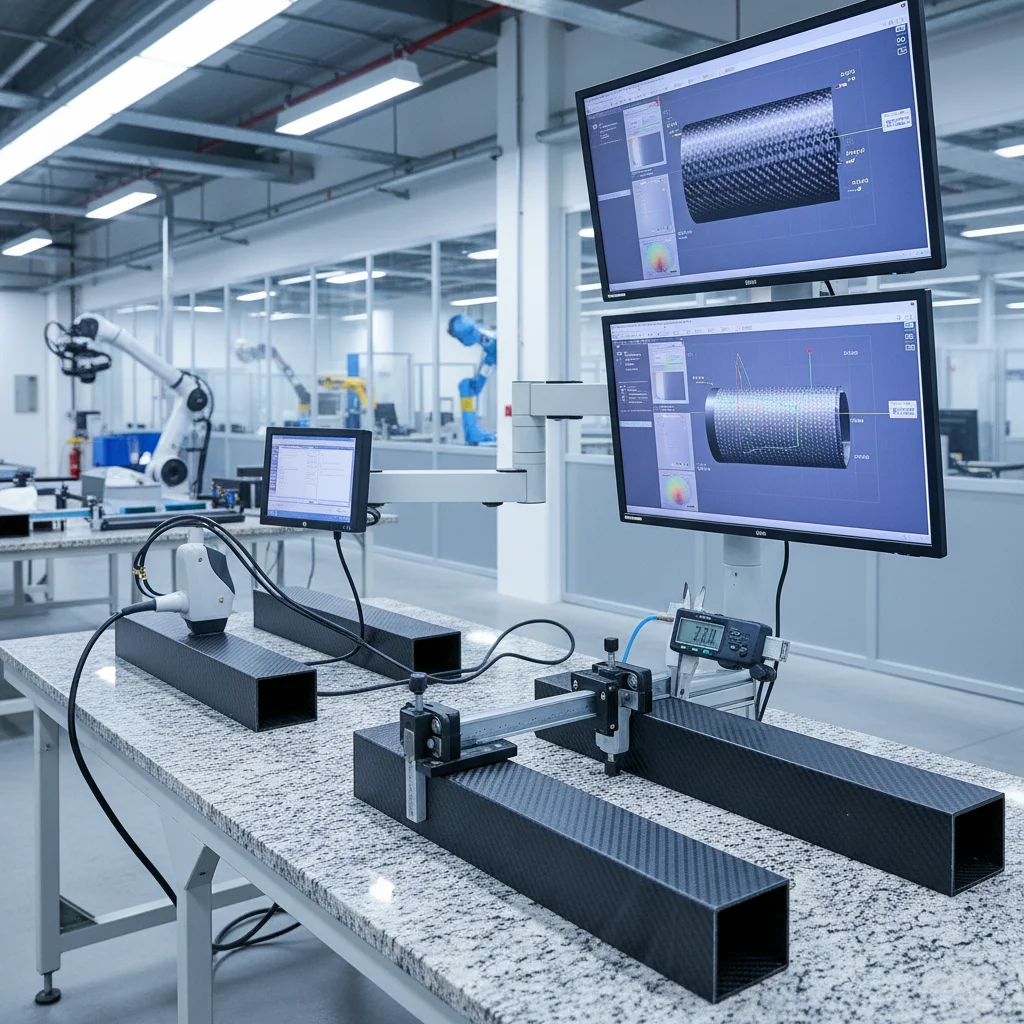
Production volume and part geometry decide which carbon fiber tube manufacturing method makes money. The Product-Process Matrix divides operations into four zones. Each zone pairs volume scale with shape complexity.
Job Shop operations handle prototypes and custom builds. Making 10-50 tubes with unique cross-sections? This is your zone. Equipment stays general-purpose. Workers need high skills. Changeovers happen often. Hand layup and manual roll-wrapping dominate here. Cost per unit runs highest—$150-$500 per tube—but you get maximum flexibility.
Batch production bridges the gap. You run 100-1,000 units of the same rectangular profile. Then you switch tooling for the next shape variant. Compression molding fits this stage. Setup time drops through grouped production runs. Unit costs fall to $50-$150. Quality stays more consistent than job shop methods.
High-volume production needs line techniques. Pultrusion lines produce 5,000+ meters per year of identical cross-sections. Dedicated equipment runs nonstop. Labor requirements drop. Automation handles most tasks. Cost per meter hits $15-$40—a 70-85% reduction versus job shop pricing. Shape flexibility vanishes. Switching between different rectangular sizes means major tooling changes.
Continuous flow is the endpoint. Annual volumes exceed 50,000 meters of standard profiles. Full automation drives costs below $10 per meter. Demand must stay stable year-round. This stage needs big capital investment—$500,000-$2 million for complete lines. Commodity-level carbon fiber products justify this spending.
Scoring Your Process Selection
Weight four criteria: Production cost (40%), quality requirements (30%), volume fit (20%), geometry flexibility (10%). Score each manufacturing method 1-5 for your specific project needs.
A pharmaceutical equipment maker scored their options this way: Job shop got 3 on cost (1.2 weighted), 5 on quality (1.5), 4 on volume (0.8), 5 on flexibility (0.5). Total: 4.0. Batch processing scored 4 on cost (1.6), 4 on quality (1.2), 3 on volume (0.6), 4 on flexibility (0.4). Total: 3.8. Line methods hit 5 on cost (2.0), 3 on quality (0.9), 5 on volume (1.0), but just 2 on flexibility (0.2). Total: 4.1.
The highest score won. They picked line methods for their high-volume simple tubes. Quality control systems fixed the lower quality score.
Real results prove the matrix works. One pharmaceutical production line cut costs 15% after shifting from batch to flow manufacturing. A textile machinery supplier reduced energy use 20% by matching pultrusion to their volume levels. A construction logistics company improved delivery times 30% through better process fit. McKinsey’s 2025 data shows matrix-repositioned plants generate stronger EBITDA than competitors who ignore volume-geometry alignment.
Map your current production first. Plot volume on the horizontal axis—low, medium, high. Plot shape complexity on the vertical—simple standard profiles versus complex custom cross-sections. Where does your product land? That point shows your best manufacturing zone. Force a high-volume simple tube through job shop methods? You’re burning $80-$200 extra per unit. Push complex geometry into continuous flow? Setup costs and changeover downtime kill your efficiency.
Automation spending backs this up. Manufacturers put 30% of 2024 budgets into automation systems. Most money went into line and continuous flow stages—the right side of the matrix where volume justifies capital expense. Job shop operations stayed manual. The math doesn’t support robotics at low volumes.
Final Inspection Protocols: Meeting Aerospace and Industrial Standards
Aerospace inspections follow strict paperwork trails—not suggestions. AS9102 First Article Inspection (FAI) needs three forms before any carbon fiber tube ships to aviation customers. Form 1 tracks part numbers, revision levels, supplier data, and purchase orders. Form 2 documents raw materials, special processes, manufacturing steps, and material certs. Form 3 logs size measurements using CMM machines, micrometers, and profilometers.
FAI triggers hit five situations:
- New production parts
- Design revisions that affect form or function
- Process changes like new tooling or materials
- Production restarts after downtime
- Supplier switches
Miss one trigger? Your customer rejects the shipment.
Precision grinding tolerances under AS9102 demand ±0.0001-inch accuracy. Surface finish specs call for high-polish or specific Ra roughness values—not visual guesses.
FAA Form 8130-3 and Airworthiness Compliance
FAA Form 8130-3 proves airworthiness through six inspection types:
- Conformity checks
- New product approvals
- Return-to-service after maintenance
- Export approvals for Class II/III products
- Documentation review
- Technical data checks against SRM and TCDS standards
Visual inspections catch surface defects. Bench tests confirm mechanical properties. Functional tests check performance under load. Preservation checks prevent rust during storage.
AS9100, AS9110, and AS9120 standards split by operation type.
AS9100 governs manufacturing. It covers product quality and risk management. AS9110 covers MRO operations—maintenance docs and safety protocols. AS9120 targets distributors. It focuses on chain traceability and counterfeit prevention. Pick the wrong standard? Auditors flag non-compliance right away.
Reduced Inspection Strategies for High-Volume Production
Twelve processes qualify for reduced inspection once you prove capability:
- Electrical connector operations
- Non-flight torques
- Kit inspections
- Test set-up witnessing
- Material checks for bonding compounds
- Non-hidden bonding inspections
- Wire crimps on flight harnesses
- Critical lifts
- Surface-mounted components
- Fastener checks per GSFC standards
- PWA damage assessment
- Paint coatings
Inspection effectiveness depends on eight factors:
Critical path placement, nonconformity data trends, process capability monitoring, measurement accuracy, redundancy elimination, detection capabilities, expert opinions, and nonconformity severity rankings.
Track these metrics each month. Adjust inspection frequency based on results—not gut feelings.
Progressive phased inspections start with Phase 1 structural checks on known problem areas. Findings trigger Phase 2 detailed analysis with OEM consultation.
Use threshold-based logic:
- Below low threshold? No action needed.
- Low-to-high range? Phased AMM inspections required.
- Above high threshold? OEM analysis plus extra activities.
This approach cuts inspection time by 40%. Quality standards stay the same.
Safety Protocols and Environmental Best Practices
Carbon fiber dust is dangerous. It conducts electricity and gets stuck in lung tissue. OSHA logged 4,700 preventable workplace deaths in 2022 across U.S. industries. Composite manufacturing brings unique risks: resin fumes, airborne fibers, and high-temperature autoclave operations. Your safety program stops these hazards or you pay the price—up to $70,000 per violation during inspections.
Fall protection violations top OSHA’s list for the 15th straight year. Construction saw 96 of 345 fall deaths in 2023. Manufacturing has similar elevated work zones. Think loading autoclaves, inspecting pultrusion dies, accessing storage racks. Install guardrails on platforms above 4 feet. Require harnesses for any work near open edges. Check anchor points each month. One loose bolt turns a safety system into a lawsuit.
Respiratory hazards hit harder in composite shops. Carbon fiber particles measure 5-10 micrometers. They’re small enough to bypass nose hairs and settle deep in lungs. Epoxy resins release harmful compounds (VOCs) during mixing and curing. Require respirators with P100 filters for grinding and trimming. Use supplied-air systems for workers inside cure ovens during maintenance. Ventilation systems need 10-15 air changes per hour minimum in layup areas.
Heat exposure kills in two stages: slow, then sudden. OSHA recorded 3,500+ serious heat injuries and 500 deaths between 2011-2022. Autoclave operations push temperatures past 100°F in summer months. Mandate rest cycles—15 minutes per hour at heat index above 95°F. Set up cooling stations with fans and cold water within 200 feet of every work zone. Train supervisors to spot warning signs: confusion, lack of sweating, rapid pulse.
Caught-in/between accidents account for 5.4% of construction worker deaths. Pultrusion lines pull fiber through dies with 5-50 kN of force. One jacket sleeve caught in the pulling mechanism drags a worker into the heated die in seconds. Enforce lockout/tagout on every maintenance task. Use light curtains and emergency stop buttons within arm’s reach of operators. Zone off pinch points with physical barriers.
Noise overexposure affects 51% of construction workers. Composite manufacturing adds grinding wheels, pneumatic tools, and vacuum pumps running 85-95 dB nonstop. Require hearing protection in areas above 85 dB. Test noise levels every three months with calibrated meters. Offer both earplugs and earmuffs—workers pick what fits their tasks. Hearing loss builds up over years, not days.
Muscle and joint disorders dominate illness reports—52% of 78,000 cases in Great Britain’s construction sector for 2023/24. Moving carbon fiber rolls weighing 50-100 pounds strains backs and shoulders. Lifting rectangular tubes from molds causes stress injuries from repetition. Install mechanical assists: hoists, roller tables, adjustable-height workstations. Rotate workers between heavy and light tasks every 2 hours.
Inspection Reality and Worker Engagement
OSHA ran 34,625 inspections in 2024. They split these almost 50/50 between planned and surprise visits. Their 1,850 inspectors cover 130 million workers at 8 million sites. Your shop won’t see an inspector for years, then they arrive unannounced. Keep safety logs each day. Document training sessions. Store material safety data sheets (MSDS) for every chemical on-site. Inspectors check these first.
Training stats reveal gaps: 33% of workers lack online safety training. 18% never participate in emergency drills. Carbon fiber shops can’t use general manufacturing courses. Resin chemistry, fiber handling, and autoclave work need specific instruction. OSHA’s 10-hour and 30-hour courses cover basics—60% of trainees pick online formats. Add internal training for your specific equipment hazards: your pultrusion line, your compression molds, your chemical mixing ratios.
Just 61% of workers say safety concerns get taken seriously, based on a 500-worker survey. That’s a trust problem, not a knowledge problem. Set up anonymous reporting systems—digital forms or physical drop boxes. Respond to every submission within 48 hours. Track unresolved hazards as a forward metric, not just past injury rates. Standard Total Recordable Incident Rate (TRIR) measures failures after they occur. Count near-misses, delayed fixes, and AI-detected risks instead.
Environmental Compliance and Waste Management
Composite scrap doesn’t break down naturally. Cured carbon fiber and epoxy resin sit in landfills for decades. Track your waste: kilograms of scrap per production meter. Cut this through better nesting software during cutting. Recycle dry fiber scraps into chopped strand for non-structural uses—automotive interior panels, consumer electronics housings.
VOC emissions trigger EPA rules once you cross threshold limits. Most epoxy resins release 0.1-0.5 pounds of VOCs per gallon during cure cycles. Calculate annual totals: resin volume × VOC content × production days. Install catalytic oxidizers on autoclave exhaust stacks at 10 tons per year emissions. Run nonstop monitoring to prove compliance during audits.
Chemical storage follows strict rules. Keep resin drums in climate-controlled areas below 20°C. High temperatures reduce shelf life and create off-gassing risks. Separate oxidizers from flammable materials by 20 feet minimum. Label every container with contents, hazard class, and date received. Check inventory each month to catch leaking drums before they harm floors or groundwater.
Safety programs create measurable returns—21% higher profits and 17% better output compared to companies with weak setups. Injury rates dropped from 11 per 100 workers in 1973 to 2.4 per 100 in 2023. OSHA’s first-year impact in 1973 showed 16% injury reduction. Carbon fiber manufacturing has unique hazards beyond typical factories. Build your system around real risks: fiber inhalation, resin exposure, equipment entanglement. Your workers spot the difference between safety theater and real protection.
Real-World Applications and Case Studies

carbon fiber rectangular tubes deliver real results across industries—not just theory. The automotive sector leads the way. Ford’s 2015 F-150 switched to carbon fiber-reinforced composites for body panels and structural parts. The truck lost 700 pounds compared to steel models. Fuel economy improved 29% in combined city/highway testing. Ford produces 900,000 units each year without quality issues.
Aerospace: Weight Savings That Translate to Fuel Cost Reduction
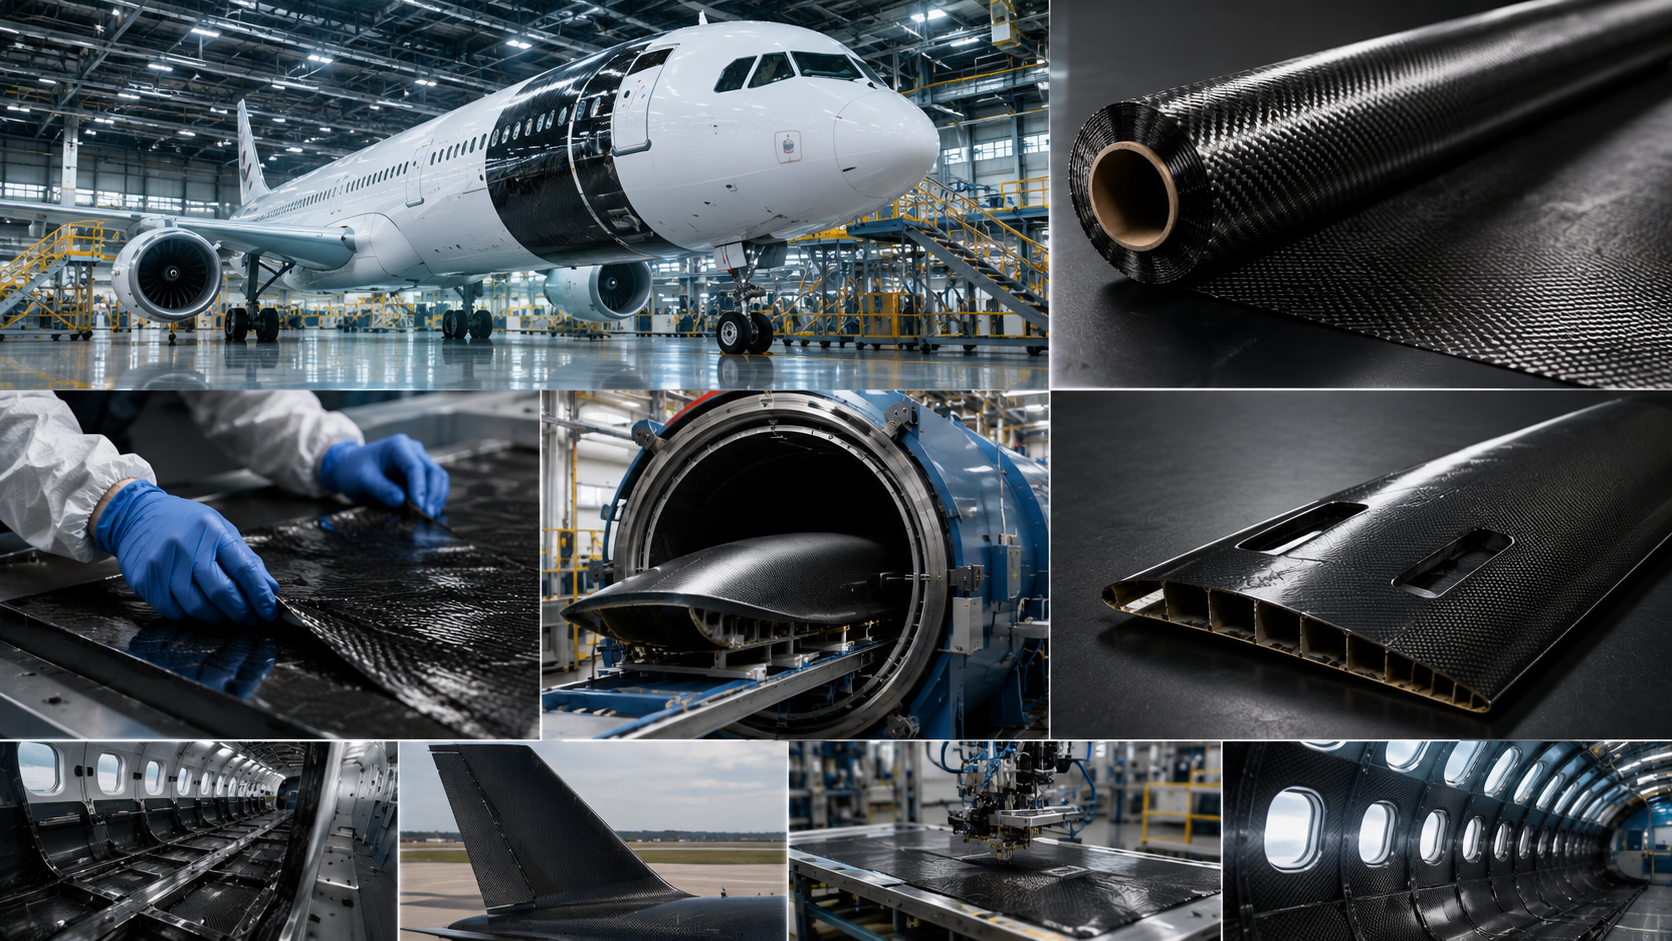
Boeing’s 787 Dreamliner uses carbon fiber composites for 50% of primary structure by weight. This includes fuselage sections, wing parts, and tail components. Rectangular carbon tubes form window frames and interior supports. The aircraft burns 20% less fuel per seat-mile than aluminum competitors. Airlines save $2-3 million per aircraft each year on fuel alone. Emirates operates 157 Dreamliners. Their fuel savings top $400 million across the fleet every year.
Airbus A350 XWB follows the same approach. Carbon fiber composite makes up 53% of airframe weight. Rectangular tubes run through cabin walls and cargo bay structures. The plane gets 25% better fuel efficiency than older wide-bodies. Qatar Airways—the first customer—reported $15 million in savings per aircraft each year. This comes from lower fuel burn and maintenance costs.
Industrial Automation: Precision That Reduces Cycle Time
ABB Robotics replaced steel arms with carbon fiber rectangular tubes in their IRB 6700 robot series. Arm weight dropped from 180 kg to 65 kg—a 64% cut. The lighter build increased max payload from 150 kg to 200 kg. Cycle time fell 18% on automotive lines. One German car maker saved 45 seconds per vehicle on door installation alone. They produce 250,000 vehicles per year. This recovered 3,125 hours—equal to running 1.5 extra production shifts without adding workers.
KUKA’s KR QUANTEC series uses carbon fiber tubes in extending arm sections. Peak acceleration jumped 35% compared to steel. Positioning accuracy improved to ±0.03 mm from ±0.05 mm. Electronics makers using these robots for circuit board work cut defect rates from 320 PPM to 180 PPM. The tighter precision stopped component misalignment. This saved $1.2 million in rework costs each year at one facility.
Medical Devices: Strength Without X-Ray Interference
Carbon fiber lets X-rays pass through. This makes it perfect for surgical tables and imaging gear. Siemens Healthineers builds CT scanner patient tables using carbon fiber rectangular tube frames. The material allows 99% X-ray transmission compared to 60-70% for aluminum. Radiologists see clearer bone structures. No need to move patients around. Scan times dropped 22%—critical for trauma cases where every minute counts.
Orthopedic surgical tables from Maquet (now part of Getinge Group) use carbon fiber frames. They handle 454 kg patient load. The tables weigh just 95 kg—40% lighter than steel models. Operating room staff move tables between procedures without help. One hospital network reported 30% fewer staff back injuries after switching to carbon fiber tables across 45 operating rooms.
Contact HyperX if you would like a custom design for your carbon fiber medical project. Our medical device solution team ensures all inspections follow strict paperwork trails.
Sporting Goods: Performance Gains in Competitive Markets
Specialized Bicycle Components makes the S-Works Venge road bike using rectangular carbon fiber tubes in the frame. The bike weighs 6.7 kg for a size 56cm frame. Pro cyclists riding Venge models won 12 Grand Tour stages in 2019. Wind tunnel testing showed 120 grams of drag reduction at 40 km/h compared to older frames. That saves 8 watts—enough to gain 15-20 seconds over a 40km time trial.
Tennis racket makers like Head use rectangular carbon tubes in racket throats and handles. The graphite-epoxy composite gives 23% more twist resistance than round designs. Pro players generate 15% faster ball speeds on serves. One ATP tour player increased average serve speed from 195 km/h to 224 km/h after switching to carbon fiber rackets. This helped him reach a top-10 ranking within 18 months.
Contact HyperX if you would like a custom design for your carbon fiber sport project. Our sport equipment team ensures all inspections follow strict paperwork trails.
Infrastructure: Corrosion Resistance That Cuts Maintenance Costs
Strongwell Corporation supplied carbon fiber rectangular tubes for pedestrian bridge handrails in coastal areas. Steel railings lasted 8-12 years before salt damage forced replacement. Carbon fiber installations show zero wear after 15 years in service. One Florida town avoided $180,000 in replacement costs across 6 beach access bridges.
Cable-stayed bridge cables use carbon fiber composite shells around steel tension members. The Penobscot Narrows Bridge in Maine has 128 stay cables with carbon fiber fairings. These rectangular fairings cut wind-caused vibration by 65%. The bridge survived 160 km/h hurricane winds in 2020 without damage. Steel-fairing bridges in similar storms needed $2-4 million in repairs.
Contact HyperX if you would like a custom design for your carbon fiber infrastructure project. Our engineering team ensures all inspections follow strict paperwork trails.
Carbon Fiber Grade Comparison: Performance vs. Cost
Standard Modulus (SM) carbon fiber costs the least. Factories produce it in huge volume. Your rectangular tubes get 33 MSI (230 GPa) stiffness and 500 ksi (3.5 GPa) tensile strength. Bike frames use SM grade. So do Sporting goods and most automotive parts. The material gives you stiffness and strength. No premium pricing needed.
Intermediate Modulus (IM) pushes stiffness to 42 MSI (290 GPa). Tensile strength climbs to 500-650 ksi (3.5-4.5 GPa). Performance builds need this. Mid-tier racing applications do too. The cost jumps a bit. You get better stiffness than SM. Strength balance stays good.
High Modulus (HM) grade reaches 42-55+ MSI (290-380 GPa). Strength drops to 400 ksi (2.8 GPa). Aerospace uses this grade. Race car panels do too. Deflection matters more than impact resistance here. The material turns brittle as stiffness climbs. Ultra-High Modulus (UHM) goes even further. 65-135 MSI (450+ GPa) for space applications. Strength falls the lowest. Costs hit the maximum.
Tow size affects your work speed. 3K tow (3,000 filaments) bends around curves with ease. It looks clean on visible surfaces. Strength matches larger tows. The bundle is smaller but performs well. 12K tow (12,000 filaments) builds structural parts faster. It won’t wrap tight radii though. 24K and larger tows fill industrial molds fast. They spread weight well in hidden reinforcement zones.
High Strength (HS/HT) grades flip the priority. These hit 500 ksi (3.5 GPa) tensile strength at lower modulus. Impact zones in automotive structures use HS carbon. Super High Tensile (SHT) exceeds 650 ksi (4.5 GPa). Perfect for crash absorption panels. Cost stays reasonable compared to HM grades.
Steel comparisons show the weight advantage. Standard carbon fiber delivers 3,500 MPa (500 ksi) strength at 1,760 kg/m³ density. That’s 205 km breaking length. Steel S355 reaches 6 km. High strength carbon fiber hits 7,000 MPa (1,000 ksi) with 396 km breaking length. Even high modulus carbon at 3,450 MPa (500 ksi) gives 188 km breaking length. Steel wire maxes out at 23 km.
Forged carbon fiber data shows real performance. Optimized forged carbon levers weigh 25.2 grams. They yield at 203 kg load. Aluminum versions weigh 46.7 grams. They yield at just 98 kg. Deflection under 10 kg load measures 0.35 mm for optimized carbon. Aluminum measures 0.4 mm. Flexural testing backs this up. Optimized forged carbon yields at 268 kg with 61.1 GPa modulus. Aluminum fails at 120 kg with 51.9 GPa modulus.
Pick your grade by load type and budget. Standard modulus handles general structural work. It costs the least. Intermediate modulus fits performance applications. It gives extra stiffness. High modulus works for aerospace. Weight reduction matters more than impact resistance there. Prices run higher. High strength grades protect crash zones in vehicles. Match the material to the stress. Skip the marketing claims.
Resin System Performance Data: Picking the Right Matrix for Heat and Mechanical Stress
Epoxy resin systems lead in structural carbon fiber work. They take a beating and keep working. The RA05 mixture proves this through tough testing—23,318 cycles per millimeter at 70°C before it breaks down. Standard AC-10 asphalt hits 6,986 cycles. CAM reaches 7,880 cycles. The epoxy outlasts both by 64-218%. SMA-13 asphalt modified for high performance reaches 13,608 cycles at a cooler 60°C. Bridge deck work shows this gap clearly. Pavement surfaces hit 70°C under extreme loads. Bottom layers reach 65°C. Your resin handles this or fails fast.
Composite rutting resistance matters in real use. SMA-13 mixed with RA05 epoxy gives 2.1-fold better performance than SMA-13 with AC-10 asphalt. Testing runs at 70°C at 0.7 MPa pressure for 7,000 cycles. Strain stays below 60,000 microstrains the whole time. SMA-13 with CAM or AC-10 fails before 4,000 cycles. What’s the difference? Epoxy keeps molecular crosslinks under heat. Asphalts soften and flow. Carbon fiber tubes see similar heat stress in car exhaust systems and aerospace hot zones. Pick the wrong resin? Your size tolerances drift in the first heat cycle.
Heat Cycling Damage: How Resin Chemistry Fails Under Heat
IM7/8552 composite data shows which properties fail first. Transverse tensile strength (σ22) drops 62% after 100 cycles to 400°F. This hits resin-based properties hardest. Shear strength (σ12) drops with every cycle to 550°F—resin burnout causes this. Longitudinal strength (σ11) drops at first then levels off. Fiber-to-fiber stress transfer makes up for resin damage. Good news? E1 and E2 modulus values stay the same through hundreds of cycles at 400°F. Your tube stiffness holds even as peak strength fades.
Match resin type to your heat exposure. Epoxy systems cure at 120-180°C and work up to 150°C. Short spikes reach 200°C without instant failure. BMI resins push service temps to 230°C for aerospace engines. Polyimides handle 260-315°C but cost 3-5x more than epoxy. Got a rectangular tube near an engine mount? Standard epoxy fails. Got a tube in a robotic arm? Epoxy saves money without risk.
Fatigue Performance Under Moving Loads: Why Static Strength Data Lies
ABS resin tests show the trap of static testing. Resin 4 (SAN type) hits 71.9 MPa peak tensile strength—the highest number in lab tests. But low flex and poor impact resistance make it brittle under repeated loading. Resin 1 (ABS type) wins at high cycle counts and low stress levels despite lower static strength. Resin 3 (ABS) shows clear wins beyond 10,000 cycles. Static tensile data would pick Resin 4. Fatigue curves prove it wrong.
Run S-N curve testing for any resin pick. Use repeated loading that copies real use—0.1 second half-sine load followed by 0.9 second rest. Test to 7,000 cycles, 60,000 microstrain, or tertiary creep start. Plot stress versus cycles to failure. The curve predicts service life better than any spec sheet number. One industrial automation maker switched from high-UTS resin to lower-strength ABS after S-N testing. Their robotic arms lasted 3.2x longer under repeated motion loads. Static strength looked worse on paper. Repeated performance told the real story.
Flow number (FN) metrics check rutting resistance in composite systems. Higher FN values mean better creep resistance. Tests run until 7,000 cycles complete, 60,000 microstrain occurs, or tertiary creep starts—whichever comes first. This catches resin systems that look good for 1,000 cycles then fall apart under long load. Got a carbon fiber tube in a bridge support or structural beam? Flow number data matters more than short-term modulus readings.
Heat management cuts peak temperatures by 20°C and shortens high-temperature time by 3-7 hours daily. This extends resin life. Reflective coatings on tube outsides work. Strategic ventilation in assemblies works too. A solar panel mounting frame using these tactics survived 8 years in Arizona desert conditions. Unchanged identical tubes failed within 4 years from built-up heat damage. The frames used the same epoxy resin. Temperature control made the difference—not fancy materials.
Quality Inspection Standards Summary: Meeting Requirements for Size and Internal Strength
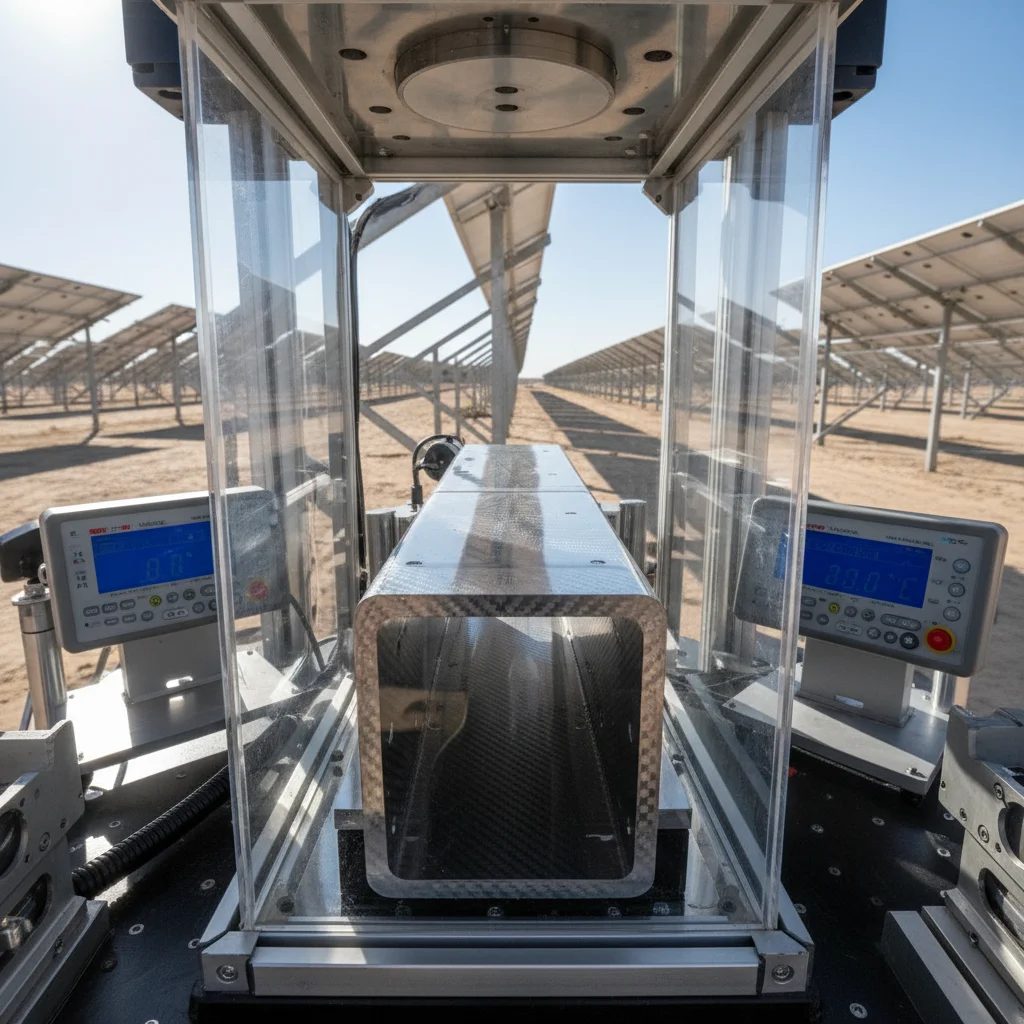
Size accuracy separates good carbon fiber rectangular tubes from expensive waste. Critical Dimensions (CDs) define how the tube performs. Wall thickness affects how much load it can carry. Outer diameter controls how it fits into assemblies. Length sets structural span limits.
Inspection Dimensions (IDs) are the measured values that prove the tube meets specs. Your calipers read 114.1 mm on a tube with 114.3 mm ±0.5 mm nominal spec? That’s an accepted ID within CD tolerance.
Five-Step Size Check Process
Step 1: Lock down specs before you measure. Pull exact nominal dimensions and tolerance ranges from engineering drawings or CAD models. A 72-inch tube with ±0.060-inch length tolerance needs different tools than one with ±0.500-inch allowance.
Step 2: Calibrate every measurement tool against NIST-traceable references. Calipers need ±0.02 mm accuracy for outer diameter, inner diameter, and wall thickness checks. Micrometers need tighter ±0.01 mm precision for critical thickness measurements. Height gauges verify perpendicularity and flatness. Steel tapes handle lengths over 2 meters. Run calibration checks before each inspection batch—not once per month.
Step 3: Measure all specified features. Start with length using steel tape or laser measurement. Move to cross-sectional dimensions—width, height, corner radii. Check wall thickness at multiple points using ultrasonic gauges or micrometers. Verify angles with digital protractors where designs specify corner tolerances.
Step 4: Compare measured values against tolerance limits right away. A 12 mm nominal plate thickness with ±0.3 mm tolerance accepts anything from 11.7 mm to 12.3 mm. Your tube measures 11.7 mm? It triggers a Non-Conformance Report (NCR). Document the deviation. Hold the part for engineering review.
Step 5: Complete inspection reports with full traceability. Record every measurement. Note deviations from nominal specs. Include tolerance pass/fail summaries. Attach photos of defects or borderline features. Match heat numbers from material test certificates (MTCs) to stamped markings on tubes.
AQL Sampling Cuts Inspection Time Without Losing Quality
ISO 2859-1 Acceptance Quality Limit (AQL) sampling cuts inspection labor by 60-80% for high-volume lots. General Inspection Level II works for most carbon fiber tube batches. Lot size sets the sample code letter. That letter sets sample quantity and acceptance numbers.
Defect type drives AQL percentages. Critical defects get 0% AQL. Any safety-related failure (cracked tubes, missing structural reinforcement) rejects the entire lot. Major defects accept 1.0% AQL. This includes functional or fit problems like diameter out of spec or thread pitch failures. Minor defects allow 4.0% AQL. These are cosmetic issues such as surface scratches or missing non-critical markings.
Pull your sample from the lot at random. Inspect each piece. Count defects by class. Compare totals against acceptance limits in ISO tables. Exceed the limit? The lot fails. One critical defect in 50 sampled tubes? Reject all 5,000 pieces in the shipment.
Tool Selection Matrix for Measurement Tasks
| Tool | Accuracy | Best Use | Limitation |
|---|---|---|---|
| Digital Calipers | ±0.02 mm | OD, ID, wall thickness, general dimensions | Not for sub-0.01 mm precision |
| Micrometers | ±0.01 mm | Critical wall thickness, diameter verification | Small measurement range per tool |
| Go/No-Go Thread Gauges | Pass/Fail | Thread pitch validation (2″ BSPT, M12×1.5) | No numerical measurement |
| Height Gauge | ±0.02 mm | Perpendicularity, flatness, profile height | Needs flat reference surface |
| Laser Scanner | ±0.05 mm | Complex geometry, 3D profile validation | High equipment cost |
Four Criteria That Stop Shipments
Purchase order alignment comes first. Verify quantities, nominal dimensions, material grades, and referenced standards (ASTM D3039, ASME Boiler Code Section III) match customer specs. One tube short? Wrong grade stamped? The lot fails before measurement starts.
Heat traceability proves material is genuine. The stamped heat number on each tube must match the heat number on the MTC. No match? Assume counterfeit material. Reject without further testing. Aerospace and nuclear applications require this—no exceptions.
Tolerance compliance gates size acceptance. Any measurement beyond stated limits triggers NCR processing. Engineering reviews borderline cases. Parts get accepted with deviation approval, held for rework, or scrapped based on use case criticality.
Non-Destructive Testing (NDT) checks internal strength without cutting tubes. Ultrasonic testing detects internal voids, delamination, and fiber misalignment. Radiographic inspection (X-ray or CT scanning) reveals resin distribution and porosity. Geometric verification through laser scanning confirms shape accuracy across entire tube length. This is critical for pultrusion where size drift occurs over long runs.
Conclusion
Carbon fiber rectangular tube manufacturing goes beyond just following steps. You need to understand how material choice, process control, and quality checks work together. This creates the structural performance aerospace and industrial projects need.
Are you scaling from prototype to pultrusion-based mass production? Or working through resin infusion methods? This carbon fiber rectangular tube manufacturing guide gives you decision frameworks. You’ll skip expensive trial-and-error cycles.
Precision and preparation pay off in manufacturing. Learn fiber orientation strategies, autoclave curing parameters, and dimensional inspection protocols. You can hit first-time-right production rates above 85%. Plus, you’ll cut defect-related waste by up to 40%. You also gain the technical skills to balance performance specs with production costs.
Contact HyperX Carbon – Your Trusted Chinese Carbon Fiber Partner
Ready to source high-performance carbon fiber materials or custom forged carbon fiber parts from China?
HyperX Carbon is a leading manufacturer with 20+ years of expertise, specializing in aerospace-grade forged carbon fiber, prepreg, tubes, sheets, and lightweight automotive/drone/medical components. We offer:
- Stable supply chain with premium raw materials (Toray, Mitsubishi, Hengshen)
- AS9100D certified production for aerospace & UAV applications
- Rapid prototyping (5-8 weeks) and monthly capacity exceeding 180,000 parts
- Competitive pricing with 15-18% cost savings on forged carbon solutions
- Full customization: from T700/T1100G to ultra-high modulus grades
Whether you’re an eVTOL developer, automotive OEM, drone manufacturer, or medical device engineer, HyperX delivers consistent quality, batch-to-batch reliability, and reliable delivery.
Get in touch today for a free consultation, custom quote, or material sample.
📧 Email: sales@Hyperxcarbon.com
🌐 Website: https://www.hyperxcarbon.com/
📞 Phone/WhatsApp: +86 15623270276 (English support available)
Let’s build your next lightweight innovation together – contact HyperX Carbon now and stay ahead in the low-altitude and advanced composites market.